
Some say volatility, rather than debt, is the best way to think about risk as an investor, but Warren Buffett famously said that 'Volatility is far from synonymous with risk.' When we think about how risky a company is, we always like to look at its use of debt, since debt overload can lead to ruin. We note that DS Smith Plc (LON:SMDS) does have debt on its balance sheet. But the real question is whether this debt is making the company risky.
When Is Debt A Problem?
Debt assists a business until the business has trouble paying it off, either with new capital or with free cash flow. Ultimately, if the company can't fulfill its legal obligations to repay debt, shareholders could walk away with nothing. However, a more common (but still painful) scenario is that it has to raise new equity capital at a low price, thus permanently diluting shareholders. Of course, plenty of companies use debt to fund growth, without any negative consequences. When we examine debt levels, we first consider both cash and debt levels, together.
View our latest analysis for DS Smith
What Is DS Smith's Debt?
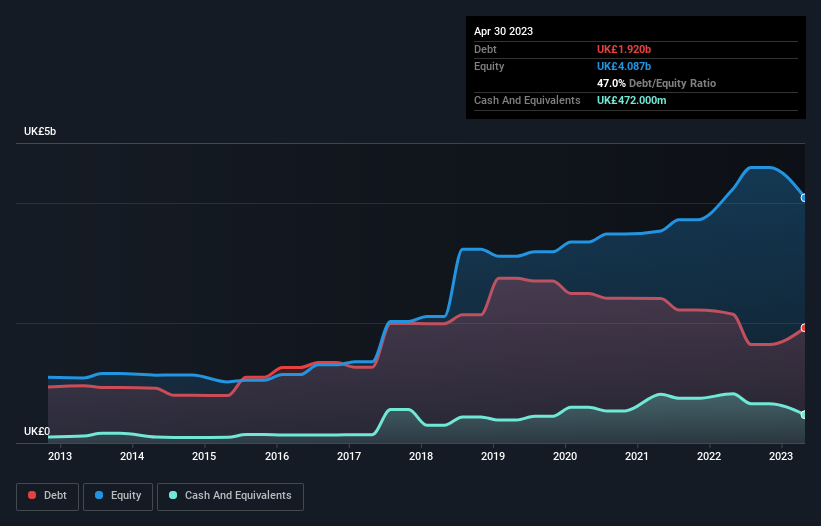
You can click the graphic below for the historical numbers, but it shows that DS Smith had UK£1.92b of debt in April 2023, down from UK£2.15b, one year before. However, it does have UK£472.0m in cash offsetting this, leading to net debt of about UK£1.45b.
How Strong Is DS Smith's Balance Sheet?
According to the last reported balance sheet, DS Smith had liabilities of UK£3.04b due within 12 months, and liabilities of UK£2.33b due beyond 12 months. Offsetting this, it had UK£472.0m in cash and UK£1.17b in receivables that were due within 12 months. So its liabilities outweigh the sum of its cash and (near-term) receivables by UK£3.73b.
This deficit is considerable relative to its market capitalization of UK£3.88b, so it does suggest shareholders should keep an eye on DS Smith's use of debt. This suggests shareholders would be heavily diluted if the company needed to shore up its balance sheet in a hurry.
We use two main ratios to inform us about debt levels relative to earnings. The first is net debt divided by earnings before interest, tax, depreciation, and amortization (EBITDA), while the second is how many times its earnings before interest and tax (EBIT) covers its interest expense (or its interest cover, for short). This way, we consider both the absolute quantum of the debt, as well as the interest rates paid on it.
DS Smith's net debt is only 1.3 times its EBITDA. And its EBIT easily covers its interest expense, being 12.9 times the size. So we're pretty relaxed about its super-conservative use of debt. On top of that, DS Smith grew its EBIT by 67% over the last twelve months, and that growth will make it easier to handle its debt. When analysing debt levels, the balance sheet is the obvious place to start. But it is future earnings, more than anything, that will determine DS Smith's ability to maintain a healthy balance sheet going forward. So if you're focused on the future you can check out this free report showing analyst profit forecasts.
Finally, a business needs free cash flow to pay off debt; accounting profits just don't cut it. So we always check how much of that EBIT is translated into free cash flow. During the last three years, DS Smith produced sturdy free cash flow equating to 80% of its EBIT, about what we'd expect. This cold hard cash means it can reduce its debt when it wants to.
Our View
DS Smith's interest cover suggests it can handle its debt as easily as Cristiano Ronaldo could score a goal against an under 14's goalkeeper. But the stark truth is that we are concerned by its level of total liabilities. Taking all this data into account, it seems to us that DS Smith takes a pretty sensible approach to debt. While that brings some risk, it can also enhance returns for shareholders. There's no doubt that we learn most about debt from the balance sheet. But ultimately, every company can contain risks that exist outside of the balance sheet. Be aware that DS Smith is showing 2 warning signs in our investment analysis , and 1 of those makes us a bit uncomfortable...
If, after all that, you're more interested in a fast growing company with a rock-solid balance sheet, then check out our list of net cash growth stocks without delay.
Mobile Infrastructure for Defense and Disaster
The next wave in robotics isn't humanoid. Its fully autonomous towers delivering 5G, ISR, and radar in under 30 minutes, anywhere.
Get the investor briefing before the next round of contracts
Sponsored On Behalf of CiTechNew: Manage All Your Stock Portfolios in One Place
We've created the ultimate portfolio companion for stock investors, and it's free.
• Connect an unlimited number of Portfolios and see your total in one currency
• Be alerted to new Warning Signs or Risks via email or mobile
• Track the Fair Value of your stocks
Have feedback on this article? Concerned about the content? Get in touch with us directly. Alternatively, email editorial-team (at) simplywallst.com.
This article by Simply Wall St is general in nature. We provide commentary based on historical data and analyst forecasts only using an unbiased methodology and our articles are not intended to be financial advice. It does not constitute a recommendation to buy or sell any stock, and does not take account of your objectives, or your financial situation. We aim to bring you long-term focused analysis driven by fundamental data. Note that our analysis may not factor in the latest price-sensitive company announcements or qualitative material. Simply Wall St has no position in any stocks mentioned.
About LSE:SMDS
DS Smith
Provides packaging solutions, paper products, and recycling services worldwide.
Slight with moderate growth potential.
Similar Companies
Market Insights

Weekly Picks

THE KINGDOM OF BROWN GOODS: WHY MGPI IS BEING CRUSHED BY INVENTORY & PRIMED FOR RESURRECTION


Why Vertical Aerospace (NYSE: EVTL) is Worth Possibly Over 13x its Current Price


The Quiet Giant That Became AI’s Power Grid
Recently Updated Narratives
Why Vertical Aerospace (NYSE: EVTL) is Worth Possibly Over 13x its Current Price

Deep Value Multi Bagger Opportunity


A case for CA$31.80 (undiluted), aka 8,616% upside from CA$0.37 (an 86 bagger!).
Popular Narratives


MicroVision will explode future revenue by 380.37% with a vision towards success


NVDA: Expanding AI Demand Will Drive Major Data Center Investments Through 2026


Crazy Undervalued 42 Baggers Silver Play (Active & Running Mine)
Trending Discussion


Thanks for sharing these. They really help when I pick what dividend stocks to invest in
