Positive Sentiment Still Eludes James Cropper PLC (LON:CRPR) Following 27% Share Price Slump
Unfortunately for some shareholders, the James Cropper PLC (LON:CRPR) share price has dived 27% in the last thirty days, prolonging recent pain. Instead of being rewarded, shareholders who have already held through the last twelve months are now sitting on a 43% share price drop.
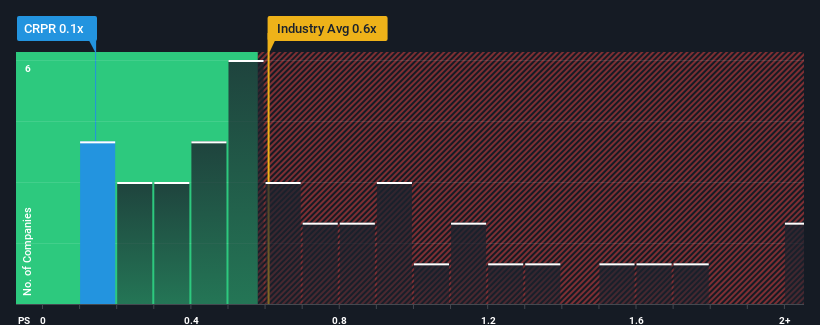
Although its price has dipped substantially, you could still be forgiven for feeling indifferent about James Cropper's P/S ratio of 0.1x, since the median price-to-sales (or "P/S") ratio for the Forestry industry in the United Kingdom is also close to 0.6x. However, investors might be overlooking a clear opportunity or potential setback if there is no rational basis for the P/S.
See our latest analysis for James Cropper

How James Cropper Has Been Performing
While the industry has experienced revenue growth lately, James Cropper's revenue has gone into reverse gear, which is not great. It might be that many expect the dour revenue performance to strengthen positively, which has kept the P/S from falling. However, if this isn't the case, investors might get caught out paying too much for the stock.
Want the full picture on analyst estimates for the company? Then our free report on James Cropper will help you uncover what's on the horizon.What Are Revenue Growth Metrics Telling Us About The P/S?
In order to justify its P/S ratio, James Cropper would need to produce growth that's similar to the industry.
Retrospectively, the last year delivered a frustrating 23% decrease to the company's top line. At least revenue has managed not to go completely backwards from three years ago in aggregate, thanks to the earlier period of growth. Accordingly, shareholders probably wouldn't have been overly satisfied with the unstable medium-term growth rates.
Shifting to the future, estimates from the lone analyst covering the company suggest revenue should grow by 12% over the next year. Meanwhile, the rest of the industry is forecast to only expand by 4.4%, which is noticeably less attractive.
With this in consideration, we find it intriguing that James Cropper's P/S is closely matching its industry peers. It may be that most investors aren't convinced the company can achieve future growth expectations.
The Final Word
Following James Cropper's share price tumble, its P/S is just clinging on to the industry median P/S. Generally, our preference is to limit the use of the price-to-sales ratio to establishing what the market thinks about the overall health of a company.
Despite enticing revenue growth figures that outpace the industry, James Cropper's P/S isn't quite what we'd expect. When we see a strong revenue outlook, with growth outpacing the industry, we can only assume potential uncertainty around these figures are what might be placing slight pressure on the P/S ratio. It appears some are indeed anticipating revenue instability, because these conditions should normally provide a boost to the share price.
You always need to take note of risks, for example - James Cropper has 2 warning signs we think you should be aware of.
Of course, profitable companies with a history of great earnings growth are generally safer bets. So you may wish to see this free collection of other companies that have reasonable P/E ratios and have grown earnings strongly.
New: Manage All Your Stock Portfolios in One Place
We've created the ultimate portfolio companion for stock investors, and it's free.
• Connect an unlimited number of Portfolios and see your total in one currency
• Be alerted to new Warning Signs or Risks via email or mobile
• Track the Fair Value of your stocks
Have feedback on this article? Concerned about the content? Get in touch with us directly. Alternatively, email editorial-team (at) simplywallst.com.
This article by Simply Wall St is general in nature. We provide commentary based on historical data and analyst forecasts only using an unbiased methodology and our articles are not intended to be financial advice. It does not constitute a recommendation to buy or sell any stock, and does not take account of your objectives, or your financial situation. We aim to bring you long-term focused analysis driven by fundamental data. Note that our analysis may not factor in the latest price-sensitive company announcements or qualitative material. Simply Wall St has no position in any stocks mentioned.
About AIM:CRPR
James Cropper
Manufactures and sells paper products and advanced materials.
Undervalued with adequate balance sheet.
Market Insights
Weekly Picks


Crazy Undervalued 42 Baggers Silver Play (Active & Running Mine)


Fiducian: Compliance Clouds or Value Opportunity?

Willamette Valley Vineyards (WVVI): Not-So-Great Value
Recently Updated Narratives

SLI is share to watch next 5 years


The "Molecular Pencil": Why Beam's Technology is Built to Win

PRME remains a long shot but publication in the New England Journal of Medicine helps.
Popular Narratives


MicroVision will explode future revenue by 380.37% with a vision towards success


NVDA: Expanding AI Demand Will Drive Major Data Center Investments Through 2026


