
Advertisement
- United Kingdom
- /
- Household Products
- /
- LSE:RKT
Shareholders in Reckitt Benckiser Group (LON:RKT) have lost 17%, as stock drops 5.6% this past week

In order to justify the effort of selecting individual stocks, it's worth striving to beat the returns from a market index fund. But in any portfolio, there will be mixed results between individual stocks. At this point some shareholders may be questioning their investment in Reckitt Benckiser Group plc (LON:RKT), since the last five years saw the share price fall 30%. Even worse, it's down 11% in about a month, which isn't fun at all.
Since Reckitt Benckiser Group has shed UK£1.9b from its value in the past 7 days, let's see if the longer term decline has been driven by the business' economics.
There is no denying that markets are sometimes efficient, but prices do not always reflect underlying business performance. One imperfect but simple way to consider how the market perception of a company has shifted is to compare the change in the earnings per share (EPS) with the share price movement.
During five years of share price growth, Reckitt Benckiser Group moved from a loss to profitability. That would generally be considered a positive, so we are surprised to see the share price is down. Other metrics might give us a better handle on how its value is changing over time.
The steady dividend doesn't really explain why the share price is down. It's not immediately clear to us why the stock price is down but further research might provide some answers.
The image below shows how earnings and revenue have tracked over time (if you click on the image you can see greater detail).
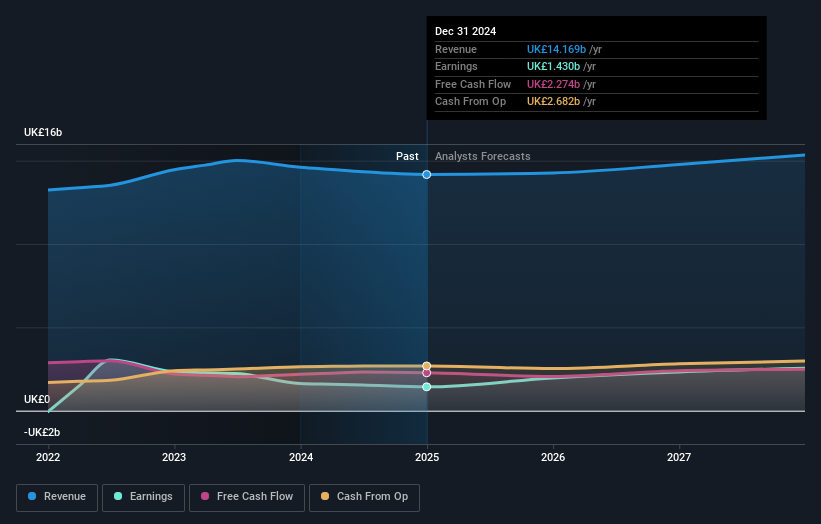
We like that insiders have been buying shares in the last twelve months. Even so, future earnings will be far more important to whether current shareholders make money. So it makes a lot of sense to check out what analysts think Reckitt Benckiser Group will earn in the future (free profit forecasts).
What About Dividends?
As well as measuring the share price return, investors should also consider the total shareholder return (TSR). The TSR is a return calculation that accounts for the value of cash dividends (assuming that any dividend received was reinvested) and the calculated value of any discounted capital raisings and spin-offs. It's fair to say that the TSR gives a more complete picture for stocks that pay a dividend. We note that for Reckitt Benckiser Group the TSR over the last 5 years was -17%, which is better than the share price return mentioned above. The dividends paid by the company have thusly boosted the total shareholder return.
A Different Perspective
We're pleased to report that Reckitt Benckiser Group shareholders have received a total shareholder return of 8.7% over one year. That's including the dividend. That certainly beats the loss of about 3% per year over the last half decade. This makes us a little wary, but the business might have turned around its fortunes. It's always interesting to track share price performance over the longer term. But to understand Reckitt Benckiser Group better, we need to consider many other factors. Take risks, for example - Reckitt Benckiser Group has 3 warning signs we think you should be aware of.
Reckitt Benckiser Group is not the only stock that insiders are buying. For those who like to find lesser know companies this free list of growing companies with recent insider purchasing, could be just the ticket.
Please note, the market returns quoted in this article reflect the market weighted average returns of stocks that currently trade on British exchanges.
New: AI Stock Screener & Alerts
Our new AI Stock Screener scans the market every day to uncover opportunities.
• Dividend Powerhouses (3%+ Yield)
• Undervalued Small Caps with Insider Buying
• High growth Tech and AI Companies
Or build your own from over 50 metrics.
Have feedback on this article? Concerned about the content? Get in touch with us directly. Alternatively, email editorial-team (at) simplywallst.com.
This article by Simply Wall St is general in nature. We provide commentary based on historical data and analyst forecasts only using an unbiased methodology and our articles are not intended to be financial advice. It does not constitute a recommendation to buy or sell any stock, and does not take account of your objectives, or your financial situation. We aim to bring you long-term focused analysis driven by fundamental data. Note that our analysis may not factor in the latest price-sensitive company announcements or qualitative material. Simply Wall St has no position in any stocks mentioned.
About LSE:RKT
Reckitt Benckiser Group
Manufactures and sells health, hygiene, and nutrition products in the United Kingdom and internationally.
Average dividend payer and fair value.
Similar Companies
Market Insights

Advertisement
Community Narratives
Pinterest will surge as advertising innovations ignite revenue growth
Fair Value US$42.63|27.0% undervalued
BR
Community Contributor
Brambles' Revenue Set to Climb 14% with Profit Margins Following
Fair Value AU$21.90|5.9% overvalued
RO
Community Contributor
Challenging Future for STG as Organic Sales Decline by 8.8%
Fair Value DKK 116.13|26.8% undervalued
KA
Community Contributor