

The external fund manager backed by Berkshire Hathaway's Charlie Munger, Li Lu, makes no bones about it when he says 'The biggest investment risk is not the volatility of prices, but whether you will suffer a permanent loss of capital.' So it seems the smart money knows that debt - which is usually involved in bankruptcies - is a very important factor, when you assess how risky a company is. We can see that Imperial Brands PLC (LON:IMB) does use debt in its business. But the more important question is: how much risk is that debt creating?
Why Does Debt Bring Risk?
Debt and other liabilities become risky for a business when it cannot easily fulfill those obligations, either with free cash flow or by raising capital at an attractive price. Ultimately, if the company can't fulfill its legal obligations to repay debt, shareholders could walk away with nothing. However, a more usual (but still expensive) situation is where a company must dilute shareholders at a cheap share price simply to get debt under control. By replacing dilution, though, debt can be an extremely good tool for businesses that need capital to invest in growth at high rates of return. When we examine debt levels, we first consider both cash and debt levels, together.
Check out our latest analysis for Imperial Brands
What Is Imperial Brands's Debt?
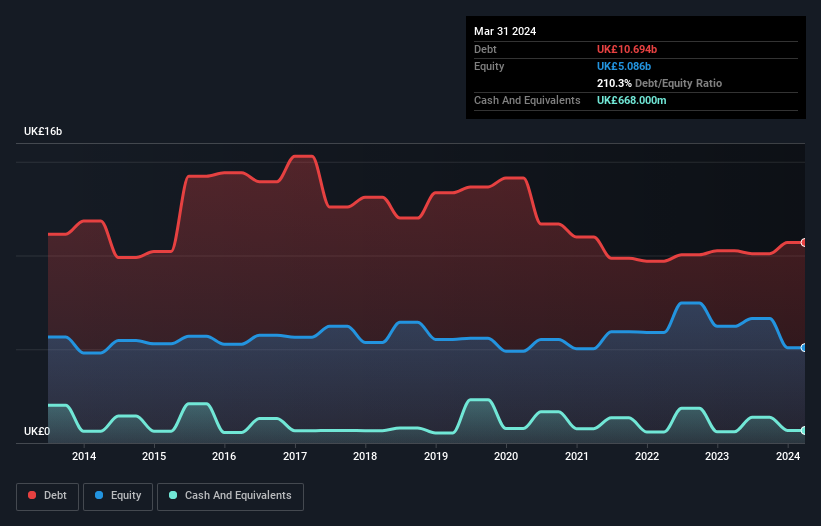
The image below, which you can click on for greater detail, shows that at March 2024 Imperial Brands had debt of UK£10.7b, up from UK£10.2b in one year. However, it does have UK£668.0m in cash offsetting this, leading to net debt of about UK£10.0b.
How Strong Is Imperial Brands' Balance Sheet?
We can see from the most recent balance sheet that Imperial Brands had liabilities of UK£13.3b falling due within a year, and liabilities of UK£10.2b due beyond that. Offsetting these obligations, it had cash of UK£668.0m as well as receivables valued at UK£2.89b due within 12 months. So its liabilities total UK£19.9b more than the combination of its cash and short-term receivables.
When you consider that this deficiency exceeds the company's huge UK£16.6b market capitalization, you might well be inclined to review the balance sheet intently. Hypothetically, extremely heavy dilution would be required if the company were forced to pay down its liabilities by raising capital at the current share price.
In order to size up a company's debt relative to its earnings, we calculate its net debt divided by its earnings before interest, tax, depreciation, and amortization (EBITDA) and its earnings before interest and tax (EBIT) divided by its interest expense (its interest cover). The advantage of this approach is that we take into account both the absolute quantum of debt (with net debt to EBITDA) and the actual interest expenses associated with that debt (with its interest cover ratio).
Imperial Brands has a debt to EBITDA ratio of 2.7, which signals significant debt, but is still pretty reasonable for most types of business. But its EBIT was about 1k times its interest expense, implying the company isn't really paying a high cost to maintain that level of debt. Even were the low cost to prove unsustainable, that is a good sign. Unfortunately, Imperial Brands saw its EBIT slide 2.4% in the last twelve months. If earnings continue on that decline then managing that debt will be difficult like delivering hot soup on a unicycle. The balance sheet is clearly the area to focus on when you are analysing debt. But ultimately the future profitability of the business will decide if Imperial Brands can strengthen its balance sheet over time. So if you want to see what the professionals think, you might find this free report on analyst profit forecasts to be interesting.
Finally, while the tax-man may adore accounting profits, lenders only accept cold hard cash. So the logical step is to look at the proportion of that EBIT that is matched by actual free cash flow. Over the most recent three years, Imperial Brands recorded free cash flow worth 79% of its EBIT, which is around normal, given free cash flow excludes interest and tax. This free cash flow puts the company in a good position to pay down debt, when appropriate.
Our View
We feel some trepidation about Imperial Brands's difficulty level of total liabilities, but we've got positives to focus on, too. For example, its interest cover and conversion of EBIT to free cash flow give us some confidence in its ability to manage its debt. Looking at all the angles mentioned above, it does seem to us that Imperial Brands is a somewhat risky investment as a result of its debt. That's not necessarily a bad thing, since leverage can boost returns on equity, but it is something to be aware of. There's no doubt that we learn most about debt from the balance sheet. However, not all investment risk resides within the balance sheet - far from it. Case in point: We've spotted 2 warning signs for Imperial Brands you should be aware of.
When all is said and done, sometimes its easier to focus on companies that don't even need debt. Readers can access a list of growth stocks with zero net debt 100% free, right now.
New: AI Stock Screener & Alerts
Our new AI Stock Screener scans the market every day to uncover opportunities.
• Dividend Powerhouses (3%+ Yield)
• Undervalued Small Caps with Insider Buying
• High growth Tech and AI Companies
Or build your own from over 50 metrics.
Have feedback on this article? Concerned about the content? Get in touch with us directly. Alternatively, email editorial-team (at) simplywallst.com.
This article by Simply Wall St is general in nature. We provide commentary based on historical data and analyst forecasts only using an unbiased methodology and our articles are not intended to be financial advice. It does not constitute a recommendation to buy or sell any stock, and does not take account of your objectives, or your financial situation. We aim to bring you long-term focused analysis driven by fundamental data. Note that our analysis may not factor in the latest price-sensitive company announcements or qualitative material. Simply Wall St has no position in any stocks mentioned.
About LSE:IMB
Imperial Brands
Manufactures, imports, markets, and sells tobacco and tobacco-related products in Europe, the Americas, Africa, the Asia, Australasia, and internationally.
Undervalued with solid track record and pays a dividend.
Similar Companies
Market Insights

Community Narratives

