- United Kingdom
- /
- Food
- /
- LSE:GNC
Investors five-year losses continue as Greencore Group (LON:GNC) dips a further 6.2% this week, earnings continue to decline


For many, the main point of investing is to generate higher returns than the overall market. But the main game is to find enough winners to more than offset the losers At this point some shareholders may be questioning their investment in Greencore Group plc (LON:GNC), since the last five years saw the share price fall 50%. We also note that the stock has performed poorly over the last year, with the share price down 20%.
Since Greencore Group has shed UK£44m from its value in the past 7 days, let's see if the longer term decline has been driven by the business' economics.
Check out our latest analysis for Greencore Group
To paraphrase Benjamin Graham: Over the short term the market is a voting machine, but over the long term it's a weighing machine. One way to examine how market sentiment has changed over time is to look at the interaction between a company's share price and its earnings per share (EPS).
Greencore Group became profitable within the last five years. That would generally be considered a positive, so we are surprised to see the share price is down. Other metrics might give us a better handle on how its value is changing over time.
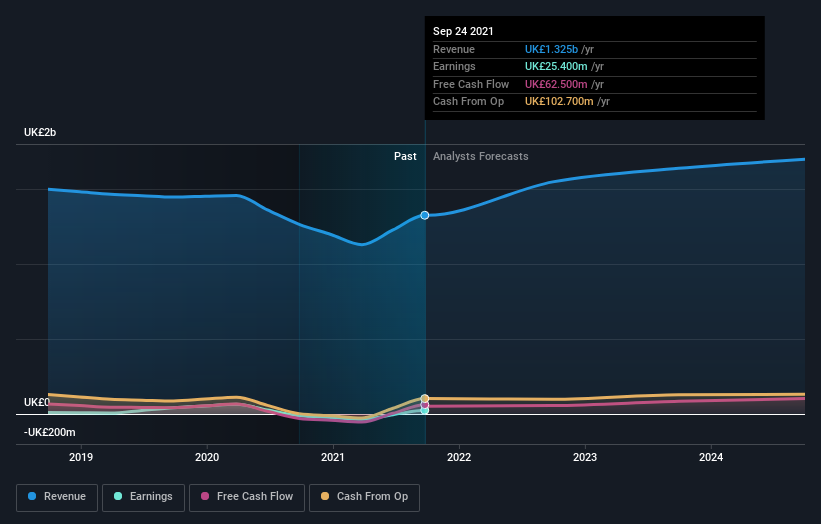
Arguably, the revenue drop of 6.0% a year for half a decade suggests that the company can't grow in the long term. This has probably encouraged some shareholders to sell down the stock.
You can see how earnings and revenue have changed over time in the image below (click on the chart to see the exact values).
It is of course excellent to see how Greencore Group has grown profits over the years, but the future is more important for shareholders. If you are thinking of buying or selling Greencore Group stock, you should check out this FREE detailed report on its balance sheet.
What about the Total Shareholder Return (TSR)?
We'd be remiss not to mention the difference between Greencore Group's total shareholder return (TSR) and its share price return. The TSR is a return calculation that accounts for the value of cash dividends (assuming that any dividend received was reinvested) and the calculated value of any discounted capital raisings and spin-offs. Dividends have been really beneficial for Greencore Group shareholders, and that cash payout explains why its total shareholder loss of 45%, over the last 5 years, isn't as bad as the share price return.
A Different Perspective
Investors in Greencore Group had a tough year, with a total loss of 20%, against a market gain of about 6.4%. Even the share prices of good stocks drop sometimes, but we want to see improvements in the fundamental metrics of a business, before getting too interested. Unfortunately, last year's performance may indicate unresolved challenges, given that it was worse than the annualised loss of 8% over the last half decade. We realise that Baron Rothschild has said investors should "buy when there is blood on the streets", but we caution that investors should first be sure they are buying a high quality business. While it is well worth considering the different impacts that market conditions can have on the share price, there are other factors that are even more important. For example, we've discovered 3 warning signs for Greencore Group (2 are significant!) that you should be aware of before investing here.
Of course Greencore Group may not be the best stock to buy. So you may wish to see this free collection of growth stocks.
Please note, the market returns quoted in this article reflect the market weighted average returns of stocks that currently trade on GB exchanges.
New: Manage All Your Stock Portfolios in One Place
We've created the ultimate portfolio companion for stock investors, and it's free.
• Connect an unlimited number of Portfolios and see your total in one currency
• Be alerted to new Warning Signs or Risks via email or mobile
• Track the Fair Value of your stocks
Have feedback on this article? Concerned about the content? Get in touch with us directly. Alternatively, email editorial-team (at) simplywallst.com.
This article by Simply Wall St is general in nature. We provide commentary based on historical data and analyst forecasts only using an unbiased methodology and our articles are not intended to be financial advice. It does not constitute a recommendation to buy or sell any stock, and does not take account of your objectives, or your financial situation. We aim to bring you long-term focused analysis driven by fundamental data. Note that our analysis may not factor in the latest price-sensitive company announcements or qualitative material. Simply Wall St has no position in any stocks mentioned.
About LSE:GNC
Greencore Group
Manufactures and sells convenience food products in the United Kingdom and Ireland.
Solid track record with excellent balance sheet.
Similar Companies
Market Insights

Community Narratives


