
Advertisement
- United Kingdom
- /
- Tobacco
- /
- LSE:BATS
Those who invested in British American Tobacco (LON:BATS) a year ago are up 46%
The simplest way to invest in stocks is to buy exchange traded funds. But you can significantly boost your returns by picking above-average stocks. To wit, the British American Tobacco p.l.c. (LON:BATS) share price is 34% higher than it was a year ago, much better than the market return of around 1.4% (not including dividends) in the same period. That's a solid performance by our standards! Zooming out, the stock is actually down 5.7% in the last three years.
So let's investigate and see if the longer term performance of the company has been in line with the underlying business' progress.
We've discovered 4 warning signs about British American Tobacco. View them for free.While markets are a powerful pricing mechanism, share prices reflect investor sentiment, not just underlying business performance. One imperfect but simple way to consider how the market perception of a company has shifted is to compare the change in the earnings per share (EPS) with the share price movement.
British American Tobacco went from making a loss to reporting a profit, in the last year.
We think the growth looks very prospective, so we're not surprised the market liked it too. Generally speaking the profitability inflection point is a great time to research a company closely, lest you miss an opportunity to profit.
The company's earnings per share (over time) is depicted in the image below (click to see the exact numbers).
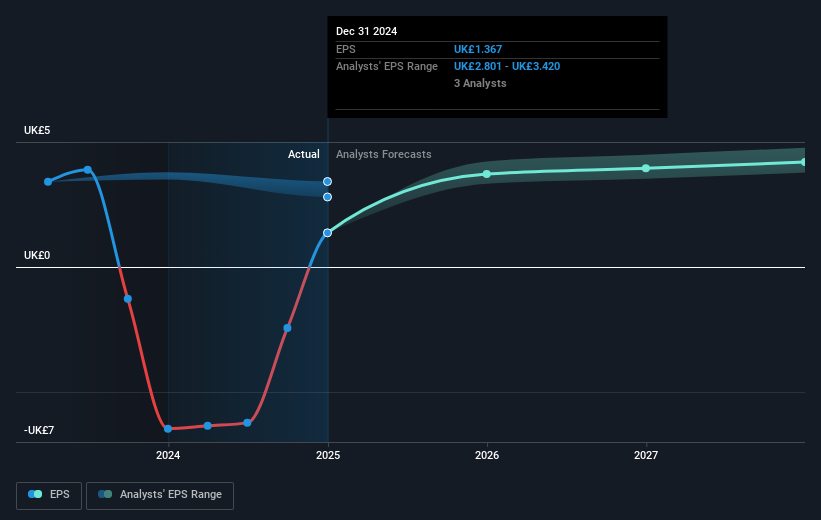
We know that British American Tobacco has improved its bottom line lately, but is it going to grow revenue? This free report showing analyst revenue forecasts should help you figure out if the EPS growth can be sustained.
What About Dividends?
As well as measuring the share price return, investors should also consider the total shareholder return (TSR). Whereas the share price return only reflects the change in the share price, the TSR includes the value of dividends (assuming they were reinvested) and the benefit of any discounted capital raising or spin-off. Arguably, the TSR gives a more comprehensive picture of the return generated by a stock. In the case of British American Tobacco, it has a TSR of 46% for the last 1 year. That exceeds its share price return that we previously mentioned. The dividends paid by the company have thusly boosted the total shareholder return.
A Different Perspective
We're pleased to report that British American Tobacco shareholders have received a total shareholder return of 46% over one year. And that does include the dividend. Since the one-year TSR is better than the five-year TSR (the latter coming in at 9% per year), it would seem that the stock's performance has improved in recent times. Given the share price momentum remains strong, it might be worth taking a closer look at the stock, lest you miss an opportunity. It's always interesting to track share price performance over the longer term. But to understand British American Tobacco better, we need to consider many other factors. For example, we've discovered 4 warning signs for British American Tobacco that you should be aware of before investing here.
If you would prefer to check out another company -- one with potentially superior financials -- then do not miss this free list of companies that have proven they can grow earnings.
Please note, the market returns quoted in this article reflect the market weighted average returns of stocks that currently trade on British exchanges.
Valuation is complex, but we're here to simplify it.
Discover if British American Tobacco might be undervalued or overvalued with our detailed analysis, featuring fair value estimates, potential risks, dividends, insider trades, and its financial condition.
Access Free AnalysisHave feedback on this article? Concerned about the content? Get in touch with us directly. Alternatively, email editorial-team (at) simplywallst.com.
This article by Simply Wall St is general in nature. We provide commentary based on historical data and analyst forecasts only using an unbiased methodology and our articles are not intended to be financial advice. It does not constitute a recommendation to buy or sell any stock, and does not take account of your objectives, or your financial situation. We aim to bring you long-term focused analysis driven by fundamental data. Note that our analysis may not factor in the latest price-sensitive company announcements or qualitative material. Simply Wall St has no position in any stocks mentioned.
About LSE:BATS
British American Tobacco
Provides tobacco and nicotine products to consumers in the Americas, Europe, the Asia-Pacific, the Middle East, Africa, and the United States.
Average dividend payer slight.
Similar Companies
Market Insights

Advertisement
Community Narratives
Pinterest will surge as advertising innovations ignite revenue growth
Fair Value US$42.63|26.1% undervalued
BR
Community Contributor
Brambles' Revenue Set to Climb 14% with Profit Margins Following
Fair Value AU$21.90|4.2% overvalued
RO
Community Contributor
Challenging Future for STG as Organic Sales Decline by 8.8%
Fair Value DKK 116.13|27.0% undervalued
KA
Community Contributor