- United Kingdom
- /
- Oil and Gas
- /
- LSE:DEC
A Piece Of The Puzzle Missing From Diversified Energy Company PLC's (LON:DEC) 28% Share Price Climb
Diversified Energy Company PLC (LON:DEC) shareholders would be excited to see that the share price has had a great month, posting a 28% gain and recovering from prior weakness. Not all shareholders will be feeling jubilant, since the share price is still down a very disappointing 24% in the last twelve months.
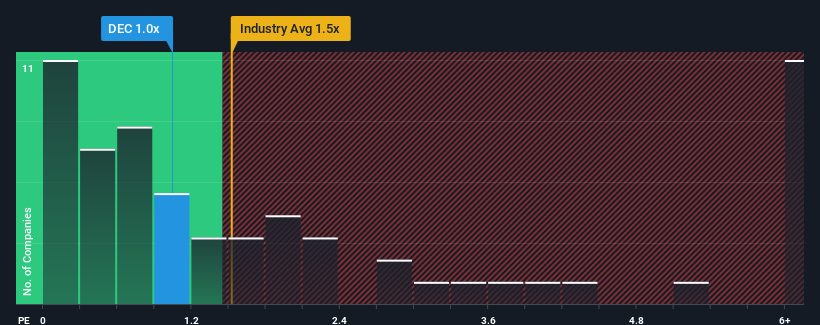
Even after such a large jump in price, it's still not a stretch to say that Diversified Energy's price-to-sales (or "P/S") ratio of 1x right now seems quite "middle-of-the-road" compared to the Oil and Gas industry in the United Kingdom, where the median P/S ratio is around 1.5x. Although, it's not wise to simply ignore the P/S without explanation as investors may be disregarding a distinct opportunity or a costly mistake.
View our latest analysis for Diversified Energy

How Diversified Energy Has Been Performing
Diversified Energy has been struggling lately as its revenue has declined faster than most other companies. One possibility is that the P/S is moderate because investors think the company's revenue trend will eventually fall in line with most others in the industry. You'd much rather the company improve its revenue if you still believe in the business. Or at the very least, you'd be hoping it doesn't keep underperforming if your plan is to pick up some stock while it's not in favour.
If you'd like to see what analysts are forecasting going forward, you should check out our free report on Diversified Energy.Is There Some Revenue Growth Forecasted For Diversified Energy?
The only time you'd be comfortable seeing a P/S like Diversified Energy's is when the company's growth is tracking the industry closely.
In reviewing the last year of financials, we were disheartened to see the company's revenues fell to the tune of 50%. That put a dampener on the good run it was having over the longer-term as its three-year revenue growth is still a noteworthy 28% in total. Accordingly, while they would have preferred to keep the run going, shareholders would be roughly satisfied with the medium-term rates of revenue growth.
Looking ahead now, revenue is anticipated to remain buoyant, climbing by 12% per annum during the coming three years according to the five analysts following the company. That would be an excellent outcome when the industry is expected to decline by 0.7% per year.
With this in mind, we find it intriguing that Diversified Energy's P/S trades in-line with its industry peers. Apparently some shareholders are skeptical of the contrarian forecasts and have been accepting lower selling prices.
The Bottom Line On Diversified Energy's P/S
Diversified Energy's stock has a lot of momentum behind it lately, which has brought its P/S level with the rest of the industry. Typically, we'd caution against reading too much into price-to-sales ratios when settling on investment decisions, though it can reveal plenty about what other market participants think about the company.
We note that even though Diversified Energy trades at a similar P/S as the rest of the industry, it far eclipses them in terms of forecasted revenue growth. There could be some unobserved threats to revenue preventing the P/S ratio from matching the positive outlook. One such risk is that the company may not live up to analysts' revenue trajectories in tough industry conditions. At least the risk of a price drop looks to be subdued, but investors seem to think future revenue could see some volatility.
Before you settle on your opinion, we've discovered 4 warning signs for Diversified Energy (1 is a bit unpleasant!) that you should be aware of.
If companies with solid past earnings growth is up your alley, you may wish to see this free collection of other companies with strong earnings growth and low P/E ratios.
New: Manage All Your Stock Portfolios in One Place
We've created the ultimate portfolio companion for stock investors, and it's free.
• Connect an unlimited number of Portfolios and see your total in one currency
• Be alerted to new Warning Signs or Risks via email or mobile
• Track the Fair Value of your stocks
Have feedback on this article? Concerned about the content? Get in touch with us directly. Alternatively, email editorial-team (at) simplywallst.com.
This article by Simply Wall St is general in nature. We provide commentary based on historical data and analyst forecasts only using an unbiased methodology and our articles are not intended to be financial advice. It does not constitute a recommendation to buy or sell any stock, and does not take account of your objectives, or your financial situation. We aim to bring you long-term focused analysis driven by fundamental data. Note that our analysis may not factor in the latest price-sensitive company announcements or qualitative material. Simply Wall St has no position in any stocks mentioned.
About LSE:DEC
Diversified Energy
Operates as an independent owner and operator of producing natural gas and oil wells primarily in the Appalachian Basin of the United States.
Undervalued with reasonable growth potential.
Similar Companies
Market Insights
Community Narratives


