- United Kingdom
- /
- Oil and Gas
- /
- AIM:UJO
Why Union Jack Oil's (LON:UJO) Shaky Earnings Are Just The Beginning Of Its Problems


Last week's earnings announcement from Union Jack Oil plc (LON:UJO) was disappointing to investors, with a sluggish profit figure. We did some analysis, and found that there are some reasons to be cautious about the headline numbers.
See our latest analysis for Union Jack Oil
Zooming In On Union Jack Oil's Earnings
One key financial ratio used to measure how well a company converts its profit to free cash flow (FCF) is the accrual ratio. The accrual ratio subtracts the FCF from the profit for a given period, and divides the result by the average operating assets of the company over that time. You could think of the accrual ratio from cashflow as the 'non-FCF profit ratio'.
As a result, a negative accrual ratio is a positive for the company, and a positive accrual ratio is a negative. While having an accrual ratio above zero is of little concern, we do think it's worth noting when a company has a relatively high accrual ratio. That's because some academic studies have suggested that high accruals ratios tend to lead to lower profit or less profit growth.
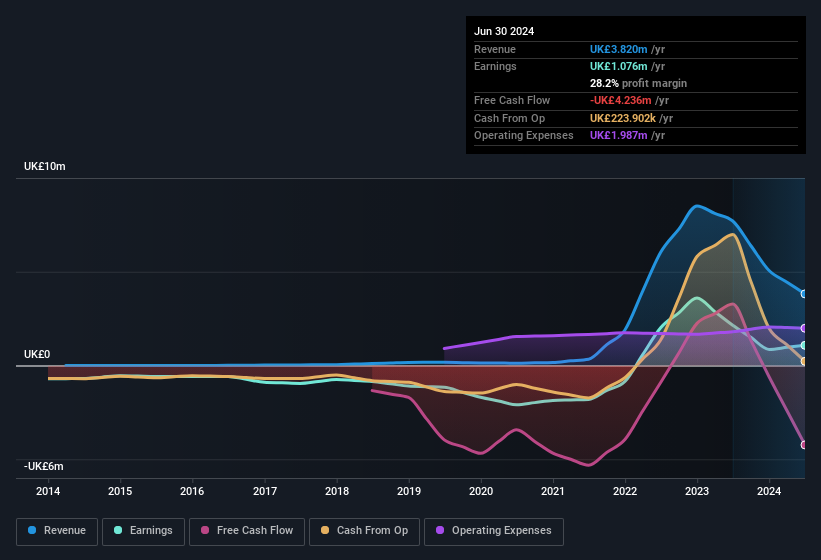
Over the twelve months to June 2024, Union Jack Oil recorded an accrual ratio of 0.30. We can therefore deduce that its free cash flow fell well short of covering its statutory profit, suggesting we might want to think twice before putting a lot of weight on the latter. Over the last year it actually had negative free cash flow of UK£4.2m, in contrast to the aforementioned profit of UK£1.08m. We saw that FCF was UK£3.3m a year ago though, so Union Jack Oil has at least been able to generate positive FCF in the past. The good news for shareholders is that Union Jack Oil's accrual ratio was much better last year, so this year's poor reading might simply be a case of a short term mismatch between profit and FCF. As a result, some shareholders may be looking for stronger cash conversion in the current year.
That might leave you wondering what analysts are forecasting in terms of future profitability. Luckily, you can click here to see an interactive graph depicting future profitability, based on their estimates.
Our Take On Union Jack Oil's Profit Performance
Union Jack Oil didn't convert much of its profit to free cash flow in the last year, which some investors may consider rather suboptimal. Therefore, it seems possible to us that Union Jack Oil's true underlying earnings power is actually less than its statutory profit. Sadly, its EPS was down over the last twelve months. The goal of this article has been to assess how well we can rely on the statutory earnings to reflect the company's potential, but there is plenty more to consider. If you want to do dive deeper into Union Jack Oil, you'd also look into what risks it is currently facing. For example, we've found that Union Jack Oil has 4 warning signs (1 is significant!) that deserve your attention before going any further with your analysis.
Today we've zoomed in on a single data point to better understand the nature of Union Jack Oil's profit. But there are plenty of other ways to inform your opinion of a company. For example, many people consider a high return on equity as an indication of favorable business economics, while others like to 'follow the money' and search out stocks that insiders are buying. While it might take a little research on your behalf, you may find this free collection of companies boasting high return on equity, or this list of stocks with significant insider holdings to be useful.
New: AI Stock Screener & Alerts
Our new AI Stock Screener scans the market every day to uncover opportunities.
• Dividend Powerhouses (3%+ Yield)
• Undervalued Small Caps with Insider Buying
• High growth Tech and AI Companies
Or build your own from over 50 metrics.
Have feedback on this article? Concerned about the content? Get in touch with us directly. Alternatively, email editorial-team (at) simplywallst.com.
This article by Simply Wall St is general in nature. We provide commentary based on historical data and analyst forecasts only using an unbiased methodology and our articles are not intended to be financial advice. It does not constitute a recommendation to buy or sell any stock, and does not take account of your objectives, or your financial situation. We aim to bring you long-term focused analysis driven by fundamental data. Note that our analysis may not factor in the latest price-sensitive company announcements or qualitative material. Simply Wall St has no position in any stocks mentioned.
About AIM:UJO
Union Jack Oil
Operates as an onshore oil and gas company in the United Kingdom and the United States.
Flawless balance sheet and slightly overvalued.
Market Insights

Community Narratives

