
Advertisement
- United Kingdom
- /
- Diversified Financial
- /
- LSE:PAY
PayPoint (LON:PAY) investors are up 8.4% in the past week, but earnings have declined over the last year

The simplest way to invest in stocks is to buy exchange traded funds. But you can significantly boost your returns by picking above-average stocks. For example, the PayPoint plc (LON:PAY) share price is up 43% in the last 1 year, clearly besting the market return of around 12% (not including dividends). So that should have shareholders smiling. However, the stock hasn't done so well in the longer term, with the stock only up 1.9% in three years.
The past week has proven to be lucrative for PayPoint investors, so let's see if fundamentals drove the company's one-year performance.
View our latest analysis for PayPoint
In his essay The Superinvestors of Graham-and-Doddsville Warren Buffett described how share prices do not always rationally reflect the value of a business. One flawed but reasonable way to assess how sentiment around a company has changed is to compare the earnings per share (EPS) with the share price.
Over the last twelve months, PayPoint actually shrank its EPS by 1.9%.
The mild decline in EPS may be a result of the fact that the company is more focused on other aspects of the business, right now. Since the change in EPS doesn't seem to correlate with the change in share price, it's worth taking a look at other metrics.
We note that the most recent dividend payment is higher than the payment a year ago, so that may have assisted the share price. Income-seeking investors probably helped bid up the stock price. Furthermore, the revenue growth of 79% probably also encouraged buyers.
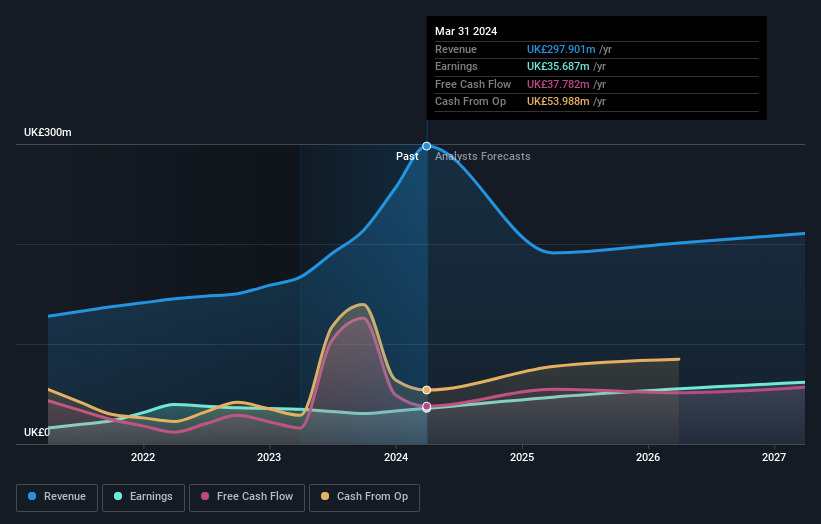
You can see below how earnings and revenue have changed over time (discover the exact values by clicking on the image).
We like that insiders have been buying shares in the last twelve months. Having said that, most people consider earnings and revenue growth trends to be a more meaningful guide to the business. So we recommend checking out this free report showing consensus forecasts
What About Dividends?
It is important to consider the total shareholder return, as well as the share price return, for any given stock. Whereas the share price return only reflects the change in the share price, the TSR includes the value of dividends (assuming they were reinvested) and the benefit of any discounted capital raising or spin-off. So for companies that pay a generous dividend, the TSR is often a lot higher than the share price return. As it happens, PayPoint's TSR for the last 1 year was 53%, which exceeds the share price return mentioned earlier. This is largely a result of its dividend payments!
A Different Perspective
We're pleased to report that PayPoint shareholders have received a total shareholder return of 53% over one year. And that does include the dividend. That gain is better than the annual TSR over five years, which is 1.7%. Therefore it seems like sentiment around the company has been positive lately. Someone with an optimistic perspective could view the recent improvement in TSR as indicating that the business itself is getting better with time. It's always interesting to track share price performance over the longer term. But to understand PayPoint better, we need to consider many other factors. For example, we've discovered 3 warning signs for PayPoint that you should be aware of before investing here.
If you like to buy stocks alongside management, then you might just love this free list of companies. (Hint: most of them are flying under the radar).
Please note, the market returns quoted in this article reflect the market weighted average returns of stocks that currently trade on British exchanges.
New: Manage All Your Stock Portfolios in One Place
We've created the ultimate portfolio companion for stock investors, and it's free.
• Connect an unlimited number of Portfolios and see your total in one currency
• Be alerted to new Warning Signs or Risks via email or mobile
• Track the Fair Value of your stocks
Have feedback on this article? Concerned about the content? Get in touch with us directly. Alternatively, email editorial-team (at) simplywallst.com.
This article by Simply Wall St is general in nature. We provide commentary based on historical data and analyst forecasts only using an unbiased methodology and our articles are not intended to be financial advice. It does not constitute a recommendation to buy or sell any stock, and does not take account of your objectives, or your financial situation. We aim to bring you long-term focused analysis driven by fundamental data. Note that our analysis may not factor in the latest price-sensitive company announcements or qualitative material. Simply Wall St has no position in any stocks mentioned.
About LSE:PAY
PayPoint
Engages in the provision of payments and banking, shopping, and e-commerce services and products in the United Kingdom.
Proven track record average dividend payer.
Market Insights

Advertisement
Community Narratives
WhiteCap Is Positioned To Profit Regardless Of Trump's Policy 
Fair Value CA$22.60|61.6% undervalued
ST
Equity Analyst and Writer
Microsoft's Evolution Will Drive Revenue to New Heights Fueled by AI
Fair Value US$360.00|28.6% overvalued
BR
Community Contributor
A CASE FOR USD$2.50 (CAD$3.44) BY 2028 (A 5-10 BAGGER)
Fair Value CA$3.44|87.5% undervalued
AG
Community Contributor