
Advertisement
- United Kingdom
- /
- Hospitality
- /
- LSE:CPG
Compass Group PLC (LON:CPG) Stock's Been Sliding But Fundamentals Look Decent: Will The Market Correct The Share Price In The Future?

Compass Group (LON:CPG) has had a rough three months with its share price down 7.5%. However, the company's fundamentals look pretty decent, and long-term financials are usually aligned with future market price movements. In this article, we decided to focus on Compass Group's ROE.
Return on Equity or ROE is a test of how effectively a company is growing its value and managing investors’ money. In simpler terms, it measures the profitability of a company in relation to shareholder's equity.
We've discovered 2 warning signs about Compass Group. View them for free.How To Calculate Return On Equity?
The formula for return on equity is:
Return on Equity = Net Profit (from continuing operations) ÷ Shareholders' Equity
So, based on the above formula, the ROE for Compass Group is:
20% = US$1.4b ÷ US$6.9b (Based on the trailing twelve months to September 2024).
The 'return' is the yearly profit. That means that for every £1 worth of shareholders' equity, the company generated £0.20 in profit.
View our latest analysis for Compass Group
What Is The Relationship Between ROE And Earnings Growth?
We have already established that ROE serves as an efficient profit-generating gauge for a company's future earnings. Depending on how much of these profits the company reinvests or "retains", and how effectively it does so, we are then able to assess a company’s earnings growth potential. Assuming everything else remains unchanged, the higher the ROE and profit retention, the higher the growth rate of a company compared to companies that don't necessarily bear these characteristics.
Compass Group's Earnings Growth And 20% ROE
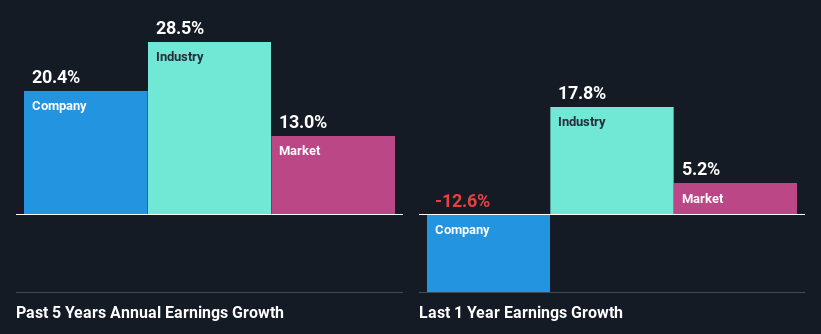
At first glance, Compass Group seems to have a decent ROE. Especially when compared to the industry average of 7.6% the company's ROE looks pretty impressive. Probably as a result of this, Compass Group was able to see an impressive net income growth of 20% over the last five years. We believe that there might also be other aspects that are positively influencing the company's earnings growth. For instance, the company has a low payout ratio or is being managed efficiently.
As a next step, we compared Compass Group's net income growth with the industry and were disappointed to see that the company's growth is lower than the industry average growth of 28% in the same period.
Earnings growth is an important metric to consider when valuing a stock. What investors need to determine next is if the expected earnings growth, or the lack of it, is already built into the share price. By doing so, they will have an idea if the stock is headed into clear blue waters or if swampy waters await. Is Compass Group fairly valued compared to other companies? These 3 valuation measures might help you decide.
Is Compass Group Efficiently Re-investing Its Profits?
The high three-year median payout ratio of 57% (implying that it keeps only 43% of profits) for Compass Group suggests that the company's growth wasn't really hampered despite it returning most of the earnings to its shareholders.
Additionally, Compass Group has paid dividends over a period of at least ten years which means that the company is pretty serious about sharing its profits with shareholders. Our latest analyst data shows that the future payout ratio of the company over the next three years is expected to be approximately 50%. Regardless, the future ROE for Compass Group is predicted to rise to 29% despite there being not much change expected in its payout ratio.
Conclusion
Overall, we feel that Compass Group certainly does have some positive factors to consider. The company has grown its earnings moderately as previously discussed. Still, the high ROE could have been even more beneficial to investors had the company been reinvesting more of its profits. As highlighted earlier, the current reinvestment rate appears to be quite low. With that said, the latest industry analyst forecasts reveal that the company's earnings growth is expected to slow down. Are these analysts expectations based on the broad expectations for the industry, or on the company's fundamentals? Click here to be taken to our analyst's forecasts page for the company.
New: AI Stock Screener & Alerts
Our new AI Stock Screener scans the market every day to uncover opportunities.
• Dividend Powerhouses (3%+ Yield)
• Undervalued Small Caps with Insider Buying
• High growth Tech and AI Companies
Or build your own from over 50 metrics.
Have feedback on this article? Concerned about the content? Get in touch with us directly. Alternatively, email editorial-team (at) simplywallst.com.
This article by Simply Wall St is general in nature. We provide commentary based on historical data and analyst forecasts only using an unbiased methodology and our articles are not intended to be financial advice. It does not constitute a recommendation to buy or sell any stock, and does not take account of your objectives, or your financial situation. We aim to bring you long-term focused analysis driven by fundamental data. Note that our analysis may not factor in the latest price-sensitive company announcements or qualitative material. Simply Wall St has no position in any stocks mentioned.
About LSE:CPG
Compass Group
Provides food and support services in North America, Europe, Asia Pacific, and internationally.
Reasonable growth potential with adequate balance sheet.
Similar Companies
Market Insights

Advertisement
Community Narratives
WhiteCap Is Positioned To Profit Regardless Of Trump's Policy 
Fair Value CA$22.60|61.6% undervalued
ST
Equity Analyst and Writer
Microsoft's Evolution Will Drive Revenue to New Heights Fueled by AI
Fair Value US$360.00|28.6% overvalued
BR
Community Contributor
A CASE FOR USD$2.50 (CAD$3.44) BY 2028 (A 5-10 BAGGER)
Fair Value CA$3.44|87.5% undervalued
AG
Community Contributor