
Advertisement
- United Kingdom
- /
- Hospitality
- /
- AIM:NXQ
The past three-year earnings decline for Nexteq (LON:NXQ) likely explains shareholders long-term losses

While it may not be enough for some shareholders, we think it is good to see the Nexteq plc (LON:NXQ) share price up 17% in a single quarter. But that doesn't help the fact that the three year return is less impressive. In fact, the share price is down 54% in the last three years, falling well short of the market return.
Although the past week has been more reassuring for shareholders, they're still in the red over the last three years, so let's see if the underlying business has been responsible for the decline.
To paraphrase Benjamin Graham: Over the short term the market is a voting machine, but over the long term it's a weighing machine. One imperfect but simple way to consider how the market perception of a company has shifted is to compare the change in the earnings per share (EPS) with the share price movement.
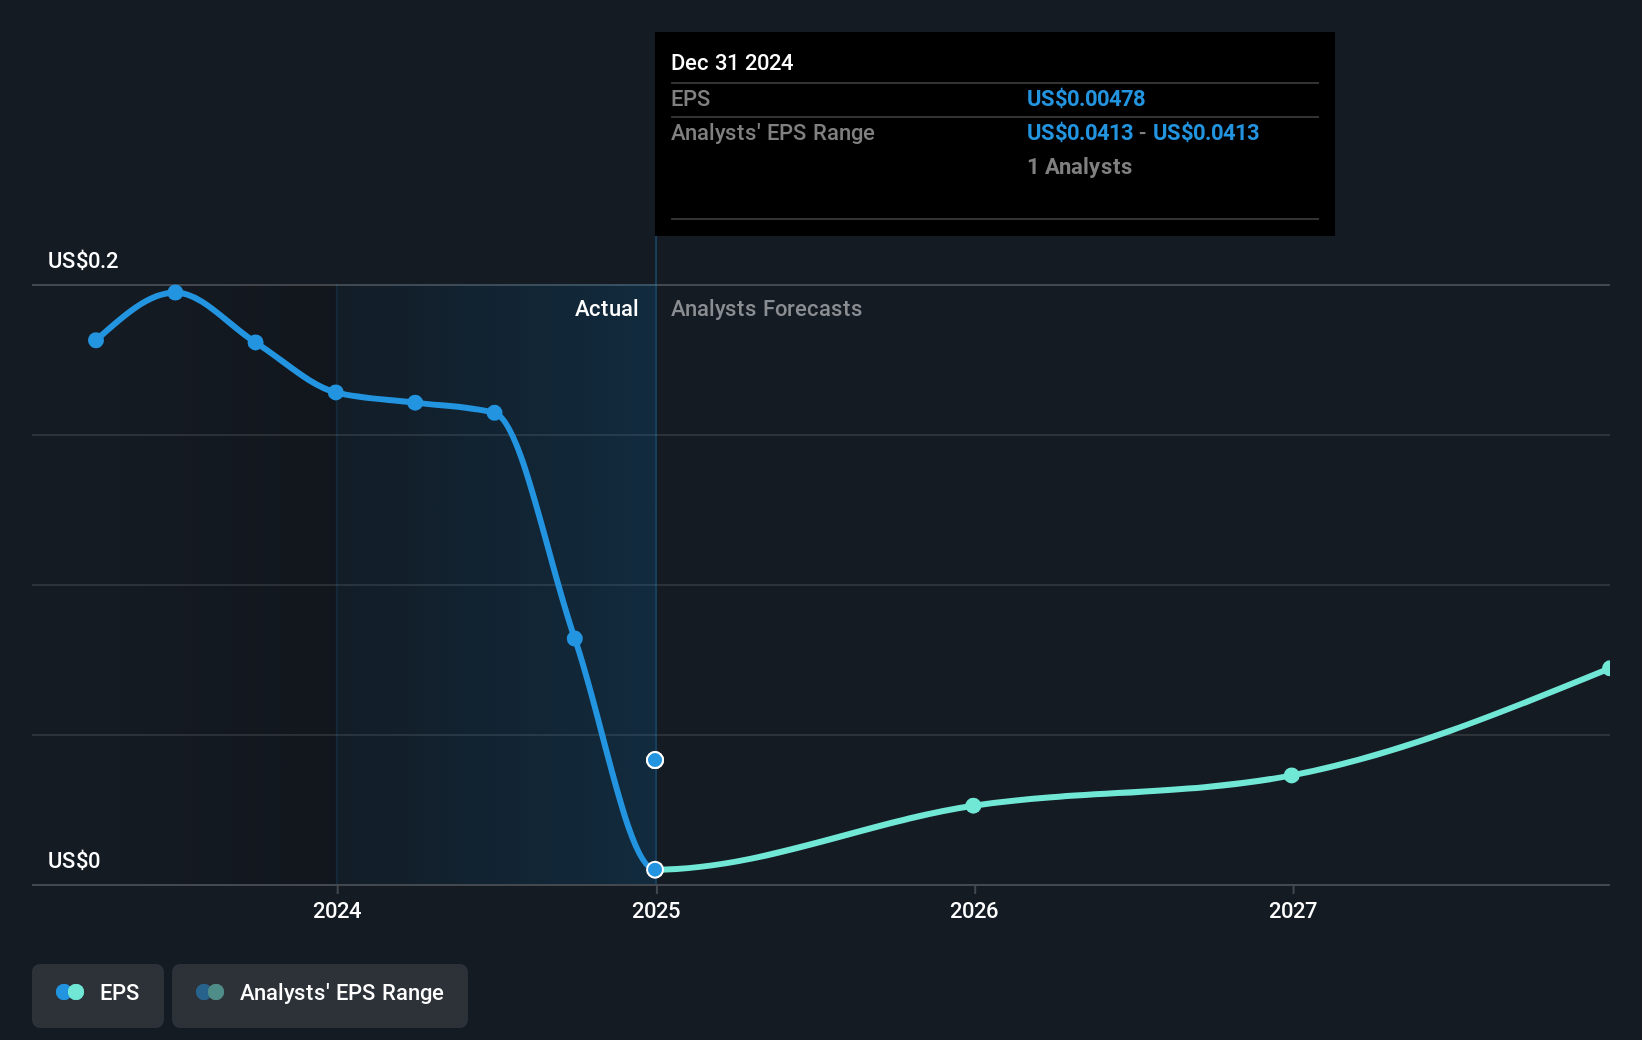
Nexteq saw its EPS decline at a compound rate of 54% per year, over the last three years. The recent extraordinary items made their mark on profits. In comparison the 23% compound annual share price decline isn't as bad as the EPS drop-off. This suggests that the market retains some optimism around long term earnings stability, despite past EPS declines. With a P/E ratio of 179.47, it's fair to say the market sees a brighter future for the business.
The graphic below depicts how EPS has changed over time (unveil the exact values by clicking on the image).
Before buying or selling a stock, we always recommend a close examination of historic growth trends, available here.
What About Dividends?
It is important to consider the total shareholder return, as well as the share price return, for any given stock. The TSR incorporates the value of any spin-offs or discounted capital raisings, along with any dividends, based on the assumption that the dividends are reinvested. Arguably, the TSR gives a more comprehensive picture of the return generated by a stock. We note that for Nexteq the TSR over the last 3 years was -48%, which is better than the share price return mentioned above. This is largely a result of its dividend payments!
A Different Perspective
Investors in Nexteq had a tough year, with a total loss of 4.9% (including dividends), against a market gain of about 13%. Even the share prices of good stocks drop sometimes, but we want to see improvements in the fundamental metrics of a business, before getting too interested. Unfortunately, longer term shareholders are suffering worse, given the loss of 5% doled out over the last five years. We'd need to see some sustained improvements in the key metrics before we could muster much enthusiasm. I find it very interesting to look at share price over the long term as a proxy for business performance. But to truly gain insight, we need to consider other information, too. Even so, be aware that Nexteq is showing 4 warning signs in our investment analysis , you should know about...
If you are like me, then you will not want to miss this free list of undervalued small caps that insiders are buying.
Please note, the market returns quoted in this article reflect the market weighted average returns of stocks that currently trade on British exchanges.
Valuation is complex, but we're here to simplify it.
Discover if Nexteq might be undervalued or overvalued with our detailed analysis, featuring fair value estimates, potential risks, dividends, insider trades, and its financial condition.
Access Free AnalysisHave feedback on this article? Concerned about the content? Get in touch with us directly. Alternatively, email editorial-team (at) simplywallst.com.
This article by Simply Wall St is general in nature. We provide commentary based on historical data and analyst forecasts only using an unbiased methodology and our articles are not intended to be financial advice. It does not constitute a recommendation to buy or sell any stock, and does not take account of your objectives, or your financial situation. We aim to bring you long-term focused analysis driven by fundamental data. Note that our analysis may not factor in the latest price-sensitive company announcements or qualitative material. Simply Wall St has no position in any stocks mentioned.
About AIM:NXQ
Nexteq
Operates as a technology solution provider to customers in industrial markets in North America, Asia, Australia, the United Kingdom, rest of Europe, and internationally.
Flawless balance sheet with reasonable growth potential.
Market Insights


Advertisement
Community Narratives
Pole position to benefit from GENIUS Act
Fair Value US$233.04|59.1% undervalued
CH
Community Contributor
IREN will transform from bitcoin miner to leader in AI infrastructure
Fair Value US$21.48|15.5% undervalued
KA
Community Contributor
Behind the Assay: XRF Scientific’s Role in Modern Mining Economics
Fair Value AU$2.10|0% overvalued
RO
Community Contributor