Advertisement
- United Kingdom
- /
- Consumer Services
- /
- AIM:CODE
Is Northcoders Group PLC's (LON:CODE) Stock Price Struggling As A Result Of Its Mixed Financials?
With its stock down 24% over the past three months, it is easy to disregard Northcoders Group (LON:CODE). It is possible that the markets have ignored the company's differing financials and decided to lean-in to the negative sentiment. Stock prices are usually driven by a company’s financial performance over the long term, and therefore we decided to pay more attention to the company's financial performance. Particularly, we will be paying attention to Northcoders Group's ROE today.
ROE or return on equity is a useful tool to assess how effectively a company can generate returns on the investment it received from its shareholders. In other words, it is a profitability ratio which measures the rate of return on the capital provided by the company's shareholders.
See our latest analysis for Northcoders Group
How To Calculate Return On Equity?
The formula for return on equity is:
Return on Equity = Net Profit (from continuing operations) ÷ Shareholders' Equity
So, based on the above formula, the ROE for Northcoders Group is:
7.7% = UK£360k ÷ UK£4.6m (Based on the trailing twelve months to December 2022).
The 'return' is the income the business earned over the last year. That means that for every £1 worth of shareholders' equity, the company generated £0.08 in profit.
What Has ROE Got To Do With Earnings Growth?
Thus far, we have learned that ROE measures how efficiently a company is generating its profits. Depending on how much of these profits the company reinvests or "retains", and how effectively it does so, we are then able to assess a company’s earnings growth potential. Assuming everything else remains unchanged, the higher the ROE and profit retention, the higher the growth rate of a company compared to companies that don't necessarily bear these characteristics.
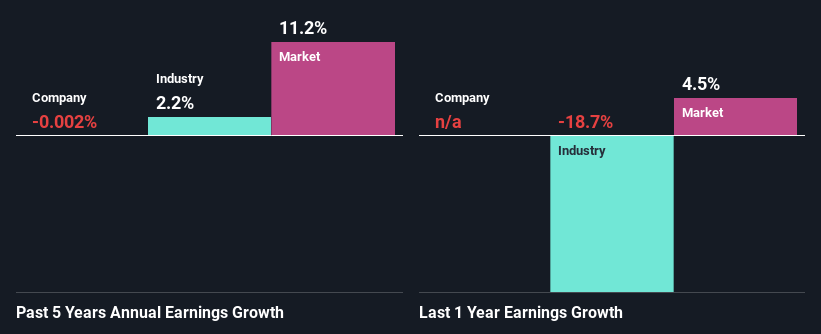
Northcoders Group's Earnings Growth And 7.7% ROE
At first glance, Northcoders Group's ROE doesn't look very promising. However, given that the company's ROE is similar to the average industry ROE of 7.0%, we may spare it some thought. However, Northcoders Group has seen a flattish net income growth over the past five years, which is not saying much. Remember, the company's ROE is not particularly great to begin with. Hence, this provides some context to the flat earnings growth seen by the company.
We then compared Northcoders Group's net income growth with the industry and found that the average industry growth rate was 2.2% in the same 5-year period.
Earnings growth is an important metric to consider when valuing a stock. It’s important for an investor to know whether the market has priced in the company's expected earnings growth (or decline). This then helps them determine if the stock is placed for a bright or bleak future. If you're wondering about Northcoders Group's's valuation, check out this gauge of its price-to-earnings ratio, as compared to its industry.
Is Northcoders Group Using Its Retained Earnings Effectively?
Northcoders Group doesn't pay any dividend, meaning that potentially all of its profits are being reinvested in the business. However, this doesn't explain why the company hasn't seen any growth. It looks like there might be some other reasons to explain the lack in that respect. For example, the business could be in decline.
Summary
On the whole, we feel that the performance shown by Northcoders Group can be open to many interpretations. While the company does have a high rate of reinvestment, the low ROE means that all that reinvestment is not reaping any benefit to its investors, and moreover, its having a negative impact on the earnings growth. Up till now, we've only made a short study of the company's growth data. So it may be worth checking this free detailed graph of Northcoders Group's past earnings, as well as revenue and cash flows to get a deeper insight into the company's performance.
Valuation is complex, but we're here to simplify it.
Discover if Northcoders Group might be undervalued or overvalued with our detailed analysis, featuring fair value estimates, potential risks, dividends, insider trades, and its financial condition.
Access Free AnalysisHave feedback on this article? Concerned about the content? Get in touch with us directly. Alternatively, email editorial-team (at) simplywallst.com.
This article by Simply Wall St is general in nature. We provide commentary based on historical data and analyst forecasts only using an unbiased methodology and our articles are not intended to be financial advice. It does not constitute a recommendation to buy or sell any stock, and does not take account of your objectives, or your financial situation. We aim to bring you long-term focused analysis driven by fundamental data. Note that our analysis may not factor in the latest price-sensitive company announcements or qualitative material. Simply Wall St has no position in any stocks mentioned.
About AIM:CODE
Northcoders Group
Provides training programs for software coding to individual and corporate customers in the United Kingdom.
Flawless balance sheet and slightly overvalued.
Market Insights


Advertisement
Weekly Picks
RI


Rick_Orford on Upside Gold ·
This Gold Stock Could Triple if Its Gold Resource Grows
Fair Value:CA$466.3% undervalued
1 followerusers have followed this narrative
0 commentsusers have commented on this narrative
0 likesusers have liked this narrative
CL


Clive_Thompson on Take-Two Interactive Software ·
Take-Two Interactive: The Calm Before the Storm NASDAQ: TTWO Last Price: $242.41 Date: May 15, 2026
Fair Value:US$276.9720.3% undervalued
26 followersusers have followed this narrative
0 commentsusers have commented on this narrative
8 likesusers have liked this narrative
NI


niteco on Honeywell International ·
Honeywell - The Demand-Side of the AI Infrastructure
Fair Value:US$320.1927.6% undervalued
13 followersusers have followed this narrative
0 commentsusers have commented on this narrative
5 likesusers have liked this narrative
BJ


Bjergby on PagSeguro Digital ·
PagSeguro: A Cheap Bet on a Bank Hiding Inside a Payments Company, Priced for Failure
Fair Value:US$23.861.3% undervalued
3 followersusers have followed this narrative
0 commentsusers have commented on this narrative
1 likeusers have liked this narrative
Recently Updated Narratives
HU

Hunter_Z on Hektar Real Estate Investment Trust ·
Hektar REIT: Deep Value, Attractive Yield, and a Portfolio Transformation Story in the Making
Fair Value:RM 156.0% undervalued
1 followerusers have followed this narrative
0 commentsusers have commented on this narrative
0 likesusers have liked this narrative
KA


kapirey on CSG ·
CSG represents a high-quality industrial compounder operating in a structurally growing and geopolitically reinforced market,
Fair Value:€3037.3% undervalued
1 followerusers have followed this narrative
0 commentsusers have commented on this narrative
0 likesusers have liked this narrative
AR

artoflosing on BlackBerry ·
Accidental transformation from Phones to Physical AI.
Fair Value:CA$16.2228.2% undervalued
1 followerusers have followed this narrative
0 commentsusers have commented on this narrative
0 likesusers have liked this narrative
Popular Narratives
GO

GoldenSands on QuantumScape ·
QuantumScape: A Mispriced Deep‑Tech Inflection Point With Multi‑Billion‑Dollar Optionality
Fair Value:US$8589.8% undervalued
116 followersusers have followed this narrative
2 commentsusers have commented on this narrative
33 likesusers have liked this narrative
TR


tripledub on lululemon athletica ·
Lululemon Got Boring Right About the Time It Got Cheap. That's Usually the Point
Fair Value:US$22042.1% undervalued
27 followersusers have followed this narrative
6 commentsusers have commented on this narrative
32 likesusers have liked this narrative
AN


AnalystConsensusTarget on NVIDIA ·
NVDA: Expanding AI Demand Will Drive Major Data Center Investments Through 2026
Fair Value:US$268.6120.0% undervalued
1192 followersusers have followed this narrative
7 commentsusers have commented on this narrative
35 likesusers have liked this narrative

