
Advertisement
- United Kingdom
- /
- Food and Staples Retail
- /
- LSE:SBRY
Are Investors Undervaluing J Sainsbury plc (LON:SBRY) By 38%?

Key Insights
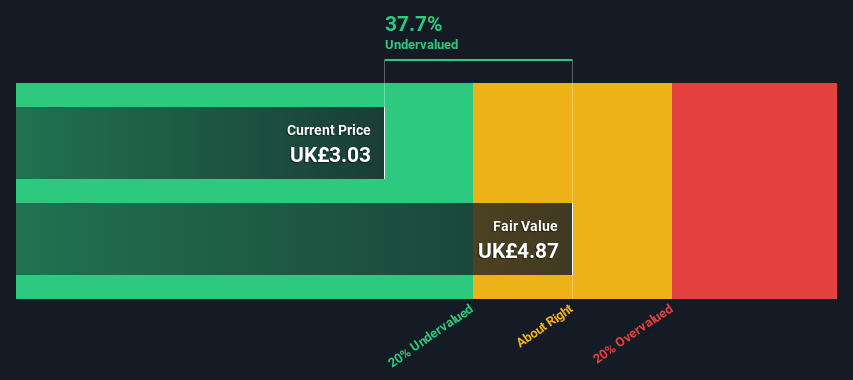
- Using the 2 Stage Free Cash Flow to Equity, J Sainsbury fair value estimate is UK£4.87
- J Sainsbury's UK£3.03 share price signals that it might be 38% undervalued
- Our fair value estimate is 68% higher than J Sainsbury's analyst price target of UK£2.89
How far off is J Sainsbury plc (LON:SBRY) from its intrinsic value? Using the most recent financial data, we'll take a look at whether the stock is fairly priced by estimating the company's future cash flows and discounting them to their present value. We will take advantage of the Discounted Cash Flow (DCF) model for this purpose. Don't get put off by the jargon, the math behind it is actually quite straightforward.
We would caution that there are many ways of valuing a company and, like the DCF, each technique has advantages and disadvantages in certain scenarios. Anyone interested in learning a bit more about intrinsic value should have a read of the Simply Wall St analysis model.
View our latest analysis for J Sainsbury
Crunching The Numbers
We use what is known as a 2-stage model, which simply means we have two different periods of growth rates for the company's cash flows. Generally the first stage is higher growth, and the second stage is a lower growth phase. In the first stage we need to estimate the cash flows to the business over the next ten years. Where possible we use analyst estimates, but when these aren't available we extrapolate the previous free cash flow (FCF) from the last estimate or reported value. We assume companies with shrinking free cash flow will slow their rate of shrinkage, and that companies with growing free cash flow will see their growth rate slow, over this period. We do this to reflect that growth tends to slow more in the early years than it does in later years.
A DCF is all about the idea that a dollar in the future is less valuable than a dollar today, and so the sum of these future cash flows is then discounted to today's value:
10-year free cash flow (FCF) forecast
| 2024 | 2025 | 2026 | 2027 | 2028 | 2029 | 2030 | 2031 | 2032 | 2033 | |
| Levered FCF (£, Millions) | UK£626.0m | UK£507.7m | UK£521.3m | UK£709.0m | UK£737.0m | UK£758.7m | UK£777.8m | UK£795.1m | UK£811.0m | UK£826.1m |
| Growth Rate Estimate Source | Analyst x2 | Analyst x3 | Analyst x3 | Analyst x1 | Analyst x1 | Est @ 2.94% | Est @ 2.52% | Est @ 2.22% | Est @ 2.01% | Est @ 1.86% |
| Present Value (£, Millions) Discounted @ 7.6% | UK£582 | UK£439 | UK£419 | UK£529 | UK£511 | UK£489 | UK£466 | UK£443 | UK£420 | UK£398 |
("Est" = FCF growth rate estimated by Simply Wall St)
Present Value of 10-year Cash Flow (PVCF) = UK£4.7b
The second stage is also known as Terminal Value, this is the business's cash flow after the first stage. For a number of reasons a very conservative growth rate is used that cannot exceed that of a country's GDP growth. In this case we have used the 5-year average of the 10-year government bond yield (1.5%) to estimate future growth. In the same way as with the 10-year 'growth' period, we discount future cash flows to today's value, using a cost of equity of 7.6%.
Terminal Value (TV)= FCF2033 × (1 + g) ÷ (r – g) = UK£826m× (1 + 1.5%) ÷ (7.6%– 1.5%) = UK£14b
Present Value of Terminal Value (PVTV)= TV / (1 + r)10= UK£14b÷ ( 1 + 7.6%)10= UK£6.7b
The total value is the sum of cash flows for the next ten years plus the discounted terminal value, which results in the Total Equity Value, which in this case is UK£11b. To get the intrinsic value per share, we divide this by the total number of shares outstanding. Compared to the current share price of UK£3.0, the company appears quite undervalued at a 38% discount to where the stock price trades currently. Remember though, that this is just an approximate valuation, and like any complex formula - garbage in, garbage out.
The Assumptions
Now the most important inputs to a discounted cash flow are the discount rate, and of course, the actual cash flows. If you don't agree with these result, have a go at the calculation yourself and play with the assumptions. The DCF also does not consider the possible cyclicality of an industry, or a company's future capital requirements, so it does not give a full picture of a company's potential performance. Given that we are looking at J Sainsbury as potential shareholders, the cost of equity is used as the discount rate, rather than the cost of capital (or weighted average cost of capital, WACC) which accounts for debt. In this calculation we've used 7.6%, which is based on a levered beta of 1.026. Beta is a measure of a stock's volatility, compared to the market as a whole. We get our beta from the industry average beta of globally comparable companies, with an imposed limit between 0.8 and 2.0, which is a reasonable range for a stable business.
SWOT Analysis for J Sainsbury
Strength
- Debt is not viewed as a risk.
Weakness
- Earnings declined over the past year.
- Dividend is low compared to the top 25% of dividend payers in the Consumer Retailing market.
Opportunity
- Annual earnings are forecast to grow faster than the British market.
- Trading below our estimate of fair value by more than 20%.
Threat
- Dividends are not covered by earnings and cashflows.
- Annual revenue is forecast to grow slower than the British market.
Moving On:
Valuation is only one side of the coin in terms of building your investment thesis, and it shouldn't be the only metric you look at when researching a company. It's not possible to obtain a foolproof valuation with a DCF model. Preferably you'd apply different cases and assumptions and see how they would impact the company's valuation. For example, changes in the company's cost of equity or the risk free rate can significantly impact the valuation. Why is the intrinsic value higher than the current share price? For J Sainsbury, we've put together three pertinent elements you should further examine:
- Risks: Consider for instance, the ever-present spectre of investment risk. We've identified 3 warning signs with J Sainsbury (at least 1 which makes us a bit uncomfortable) , and understanding them should be part of your investment process.
- Future Earnings: How does SBRY's growth rate compare to its peers and the wider market? Dig deeper into the analyst consensus number for the upcoming years by interacting with our free analyst growth expectation chart.
- Other Solid Businesses: Low debt, high returns on equity and good past performance are fundamental to a strong business. Why not explore our interactive list of stocks with solid business fundamentals to see if there are other companies you may not have considered!
PS. Simply Wall St updates its DCF calculation for every British stock every day, so if you want to find the intrinsic value of any other stock just search here.
New: Manage All Your Stock Portfolios in One Place
We've created the ultimate portfolio companion for stock investors, and it's free.
• Connect an unlimited number of Portfolios and see your total in one currency
• Be alerted to new Warning Signs or Risks via email or mobile
• Track the Fair Value of your stocks
Have feedback on this article? Concerned about the content? Get in touch with us directly. Alternatively, email editorial-team (at) simplywallst.com.
This article by Simply Wall St is general in nature. We provide commentary based on historical data and analyst forecasts only using an unbiased methodology and our articles are not intended to be financial advice. It does not constitute a recommendation to buy or sell any stock, and does not take account of your objectives, or your financial situation. We aim to bring you long-term focused analysis driven by fundamental data. Note that our analysis may not factor in the latest price-sensitive company announcements or qualitative material. Simply Wall St has no position in any stocks mentioned.
About LSE:SBRY
J Sainsbury
Engages in the food, general merchandise and clothing retailing, and financial services activities in the United Kingdom and the Republic of Ireland.
Excellent balance sheet with proven track record.
Similar Companies
Market Insights


Advertisement
Community Narratives
Nike's Direct-to-Consumer Focus Will Drive Future Growth
Fair Value US$87.90|18.2% undervalued
UN
Community Contributor
Novo Nordisk will dominate GLP-1 market with Ozempic and Wegovy growth
Fair Value US$89.59|12.1% undervalued
BE
Community Contributor
Rheinmetall could get 20-25% of EU-NATO 3%-GDP defence spending
Fair Value €7.57k|82.4% undervalued
NO
Community Contributor