
Advertisement
Investing in Marks and Spencer Group (LON:MKS) five years ago would have delivered you a 253% gain

While Marks and Spencer Group plc (LON:MKS) shareholders are probably generally happy, the stock hasn't had particularly good run recently, with the share price falling 18% in the last quarter. But that scarcely detracts from the really solid long term returns generated by the company over five years. In fact, the share price is 246% higher today. So while it's never fun to see a share price fall, it's important to look at a longer time horizon. Only time will tell if there is still too much optimism currently reflected in the share price.
So let's investigate and see if the longer term performance of the company has been in line with the underlying business' progress.
There is no denying that markets are sometimes efficient, but prices do not always reflect underlying business performance. By comparing earnings per share (EPS) and share price changes over time, we can get a feel for how investor attitudes to a company have morphed over time.
Over half a decade, Marks and Spencer Group managed to grow its earnings per share at 64% a year. The EPS growth is more impressive than the yearly share price gain of 28% over the same period. So one could conclude that the broader market has become more cautious towards the stock.
The company's earnings per share (over time) is depicted in the image below (click to see the exact numbers).
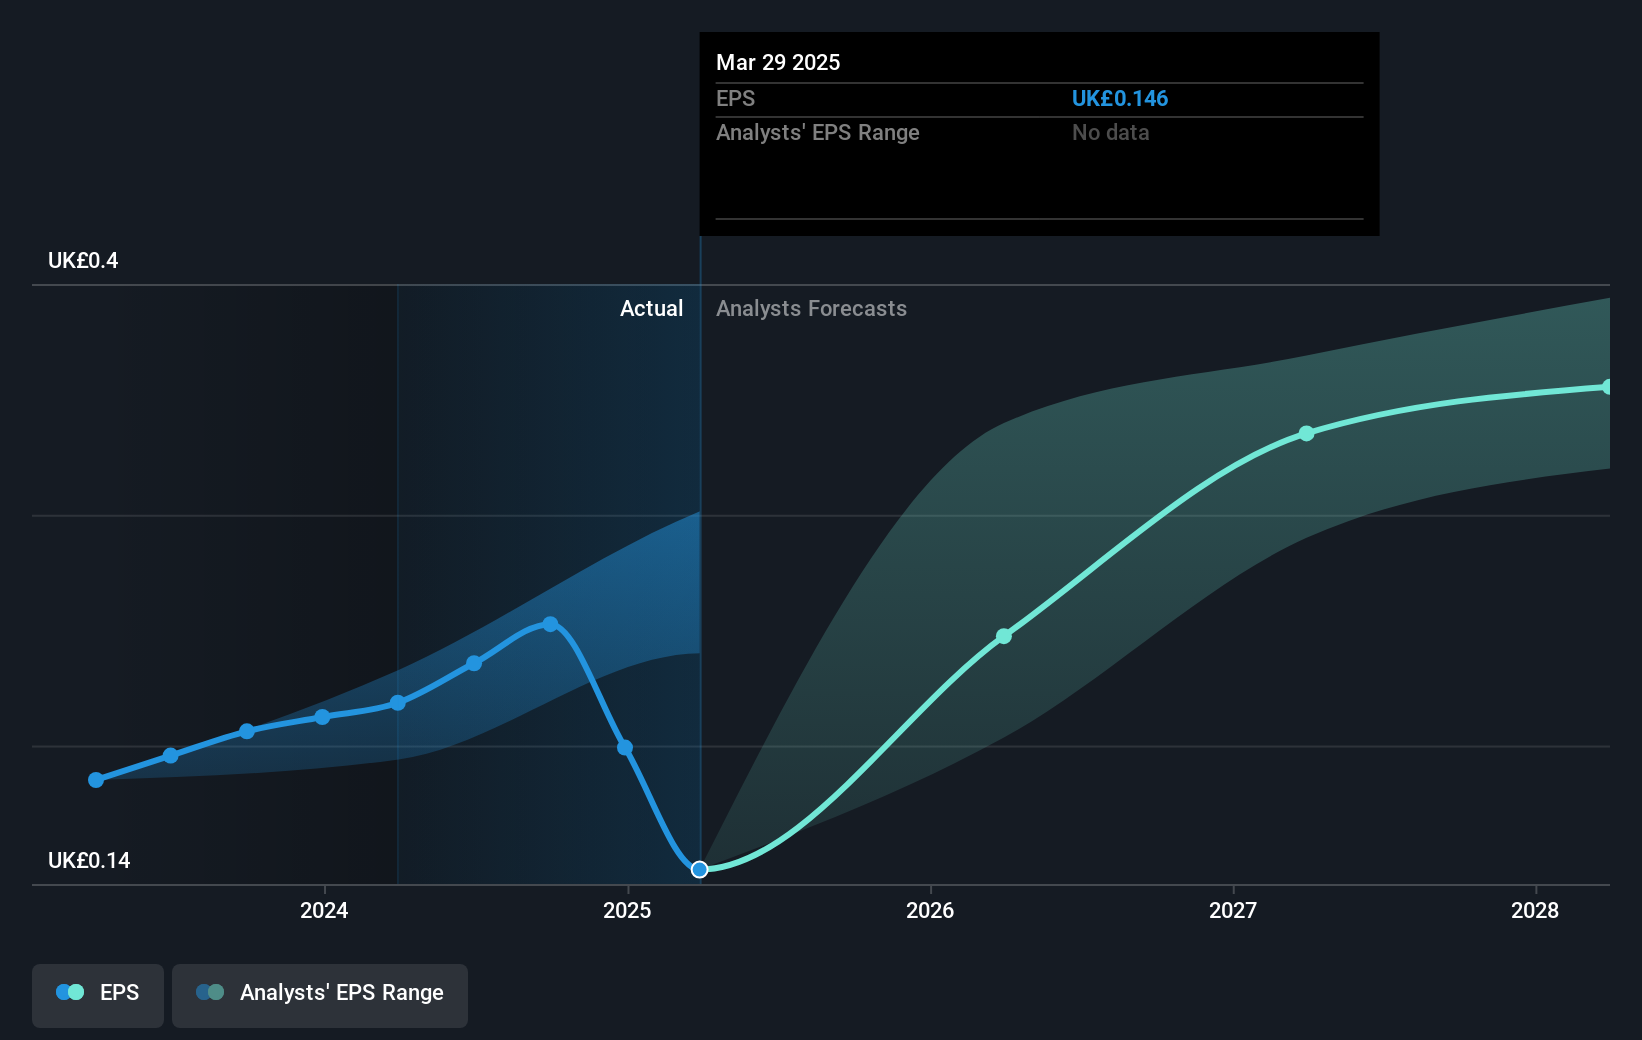
Before buying or selling a stock, we always recommend a close examination of historic growth trends, available here.
What About Dividends?
It is important to consider the total shareholder return, as well as the share price return, for any given stock. Whereas the share price return only reflects the change in the share price, the TSR includes the value of dividends (assuming they were reinvested) and the benefit of any discounted capital raising or spin-off. It's fair to say that the TSR gives a more complete picture for stocks that pay a dividend. As it happens, Marks and Spencer Group's TSR for the last 5 years was 253%, which exceeds the share price return mentioned earlier. And there's no prize for guessing that the dividend payments largely explain the divergence!
A Different Perspective
Marks and Spencer Group provided a TSR of 9.1% over the year (including dividends). That's fairly close to the broader market return. We should note here that the five-year TSR is more impressive, at 29% per year. More recently, the share price growth has slowed. But it has to be said the overall picture is one of good long term and short term performance. Arguably that makes Marks and Spencer Group a stock worth watching. It's always interesting to track share price performance over the longer term. But to understand Marks and Spencer Group better, we need to consider many other factors. For instance, we've identified 2 warning signs for Marks and Spencer Group that you should be aware of.
We will like Marks and Spencer Group better if we see some big insider buys. While we wait, check out this free list of undervalued stocks (mostly small caps) with considerable, recent, insider buying.
Please note, the market returns quoted in this article reflect the market weighted average returns of stocks that currently trade on British exchanges.
New: Manage All Your Stock Portfolios in One Place
We've created the ultimate portfolio companion for stock investors, and it's free.
• Connect an unlimited number of Portfolios and see your total in one currency
• Be alerted to new Warning Signs or Risks via email or mobile
• Track the Fair Value of your stocks
Have feedback on this article? Concerned about the content? Get in touch with us directly. Alternatively, email editorial-team (at) simplywallst.com.
This article by Simply Wall St is general in nature. We provide commentary based on historical data and analyst forecasts only using an unbiased methodology and our articles are not intended to be financial advice. It does not constitute a recommendation to buy or sell any stock, and does not take account of your objectives, or your financial situation. We aim to bring you long-term focused analysis driven by fundamental data. Note that our analysis may not factor in the latest price-sensitive company announcements or qualitative material. Simply Wall St has no position in any stocks mentioned.
About LSE:MKS
Good value with adequate balance sheet.
Similar Companies
Market Insights


Advertisement
Community Narratives
Pole position to benefit from GENIUS Act
Fair Value US$233.04|59.0% undervalued
CH
Community Contributor
IREN will transform from bitcoin miner to leader in AI infrastructure
Fair Value US$21.48|22.8% undervalued
KA
Community Contributor
Behind the Assay: XRF Scientific’s Role in Modern Mining Economics
Fair Value AU$2.10|4.3% undervalued
RO
Community Contributor