- United Kingdom
- /
- Food and Staples Retail
- /
- LSE:MCLS
Here's What To Make Of McColl's Retail Group's (LON:MCLS) Returns On Capital


To find a multi-bagger stock, what are the underlying trends we should look for in a business? Firstly, we'll want to see a proven return on capital employed (ROCE) that is increasing, and secondly, an expanding base of capital employed. Basically this means that a company has profitable initiatives that it can continue to reinvest in, which is a trait of a compounding machine. However, after briefly looking over the numbers, we don't think McColl's Retail Group (LON:MCLS) has the makings of a multi-bagger going forward, but let's have a look at why that may be.
Understanding Return On Capital Employed (ROCE)
Just to clarify if you're unsure, ROCE is a metric for evaluating how much pre-tax income (in percentage terms) a company earns on the capital invested in its business. Analysts use this formula to calculate it for McColl's Retail Group:
Return on Capital Employed = Earnings Before Interest and Tax (EBIT) ÷ (Total Assets - Current Liabilities)
0.053 = UK£19m ÷ (UK£625m - UK£260m) (Based on the trailing twelve months to May 2020).
Therefore, McColl's Retail Group has an ROCE of 5.3%. Ultimately, that's a low return and it under-performs the Consumer Retailing industry average of 13%.
View our latest analysis for McColl's Retail Group
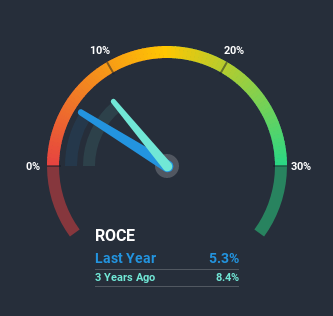
Above you can see how the current ROCE for McColl's Retail Group compares to its prior returns on capital, but there's only so much you can tell from the past. If you'd like to see what analysts are forecasting going forward, you should check out our free report for McColl's Retail Group.
What Can We Tell From McColl's Retail Group's ROCE Trend?
In terms of McColl's Retail Group's historical ROCE movements, the trend isn't fantastic. Over the last five years, returns on capital have decreased to 5.3% from 13% five years ago. However it looks like McColl's Retail Group might be reinvesting for long term growth because while capital employed has increased, the company's sales haven't changed much in the last 12 months. It may take some time before the company starts to see any change in earnings from these investments.
Another thing to note, McColl's Retail Group has a high ratio of current liabilities to total assets of 42%. This can bring about some risks because the company is basically operating with a rather large reliance on its suppliers or other sorts of short-term creditors. While it's not necessarily a bad thing, it can be beneficial if this ratio is lower.
The Bottom Line On McColl's Retail Group's ROCE
In summary, McColl's Retail Group is reinvesting funds back into the business for growth but unfortunately it looks like sales haven't increased much just yet. And investors may be expecting the fundamentals to get a lot worse because the stock has crashed 76% over the last five years. On the whole, we aren't too inspired by the underlying trends and we think there may be better chances of finding a multi-bagger elsewhere.
One final note, you should learn about the 4 warning signs we've spotted with McColl's Retail Group (including 1 which doesn't sit too well with us) .
While McColl's Retail Group isn't earning the highest return, check out this free list of companies that are earning high returns on equity with solid balance sheets.
When trading McColl's Retail Group or any other investment, use the platform considered by many to be the Professional's Gateway to the Worlds Market, Interactive Brokers. You get the lowest-cost* trading on stocks, options, futures, forex, bonds and funds worldwide from a single integrated account. Promoted
New: Manage All Your Stock Portfolios in One Place
We've created the ultimate portfolio companion for stock investors, and it's free.
• Connect an unlimited number of Portfolios and see your total in one currency
• Be alerted to new Warning Signs or Risks via email or mobile
• Track the Fair Value of your stocks
This article by Simply Wall St is general in nature. It does not constitute a recommendation to buy or sell any stock, and does not take account of your objectives, or your financial situation. We aim to bring you long-term focused analysis driven by fundamental data. Note that our analysis may not factor in the latest price-sensitive company announcements or qualitative material. Simply Wall St has no position in any stocks mentioned.
*Interactive Brokers Rated Lowest Cost Broker by StockBrokers.com Annual Online Review 2020
Have feedback on this article? Concerned about the content? Get in touch with us directly. Alternatively, email editorial-team (at) simplywallst.com.
About LSE:MCLS
McColl's Retail Group
McColl's Retail Group plc operates as a neighbourhood retailer in the United Kingdom.
Weak fundamentals or lack of information.

