

Want to participate in a short research study? Help shape the future of investing tools and you could win a $250 gift card!
The external fund manager backed by Berkshire Hathaway's Charlie Munger, Li Lu, makes no bones about it when he says 'The biggest investment risk is not the volatility of prices, but whether you will suffer a permanent loss of capital.' So it might be obvious that you need to consider debt, when you think about how risky any given stock is, because too much debt can sink a company. We can see that Tandem Group plc (LON:TND) does use debt in its business. But the real question is whether this debt is making the company risky.
Why Does Debt Bring Risk?
Debt assists a business until the business has trouble paying it off, either with new capital or with free cash flow. If things get really bad, the lenders can take control of the business. While that is not too common, we often do see indebted companies permanently diluting shareholders because lenders force them to raise capital at a distressed price. Of course, debt can be an important tool in businesses, particularly capital heavy businesses. The first step when considering a company's debt levels is to consider its cash and debt together.
Check out our latest analysis for Tandem Group
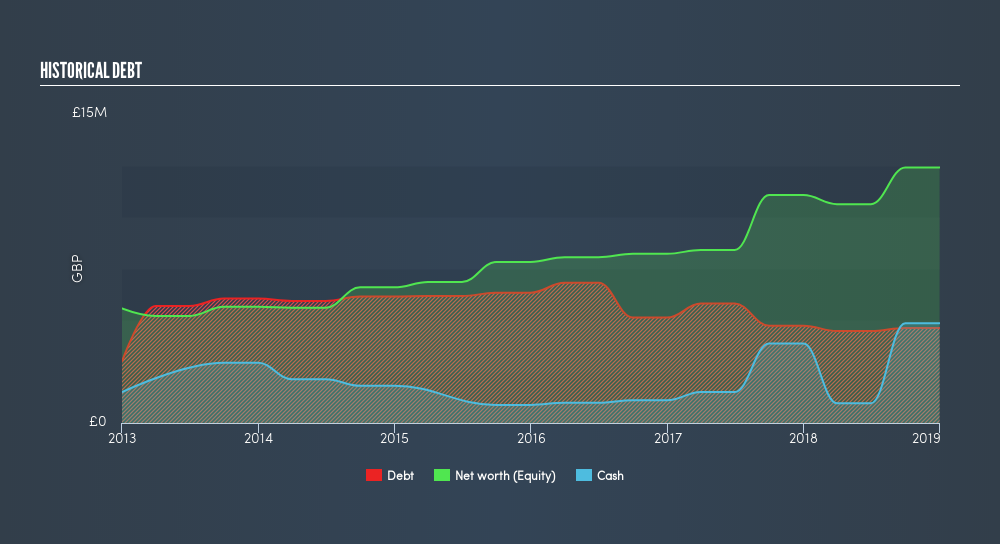
What Is Tandem Group's Net Debt?
The chart below, which you can click on for greater detail, shows that Tandem Group had UK£4.74m in debt in December 2018; about the same as the year before. However, it does have UK£4.85m in cash offsetting this, leading to net cash of UK£107.0k.
How Healthy Is Tandem Group's Balance Sheet?
Zooming in on the latest balance sheet data, we can see that Tandem Group had liabilities of UK£7.95m due within 12 months and liabilities of UK£4.03m due beyond that. Offsetting this, it had UK£4.85m in cash and UK£4.24m in receivables that were due within 12 months. So its liabilities outweigh the sum of its cash and (near-term) receivables by UK£2.89m.
While this might seem like a lot, it is not so bad since Tandem Group has a market capitalization of UK£10.1m, and so it could probably strengthen its balance sheet by raising capital if it needed to. However, it is still worthwhile taking a close look at its ability to pay off debt. Given that Tandem Group has more cash than debt, we're pretty confident it can manage its debt safely.
On the other hand, Tandem Group saw its EBIT drop by 6.4% in the last twelve months. That sort of decline, if sustained, will obviously make debt harder to handle. When analysing debt levels, the balance sheet is the obvious place to start. But it is Tandem Group's earnings that will influence how the balance sheet holds up in the future. So if you're keen to discover more about its earnings, it might be worth checking out this graph of its long term earnings trend.
Finally, a business needs free cash flow to pay off debt; accounting profits just don't cut it. While Tandem Group has net cash on its balance sheet, it's still worth taking a look at its ability to convert earnings before interest and tax (EBIT) to free cash flow, to help us understand how quickly it is building (or eroding) that cash balance. Happily for any shareholders, Tandem Group actually produced more free cash flow than EBIT over the last three years. That sort of strong cash conversion gets us excited like the crowd when the beat drops at a Daft Punk concert.
Summing up
While Tandem Group does have more liabilities than liquid assets, it also has net cash of UK£107k. And it impressed us with free cash flow of UK£1.2m, being 108% of its EBIT. So we don't have any problem with Tandem Group's use of debt. Above most other metrics, we think its important to track how fast earnings per share is growing, if at all. If you've also come to that realization, you're in luck, because today you can view this interactive graph of Tandem Group's earnings per share history for free.
Of course, if you're the type of investor who prefers buying stocks without the burden of debt, then don't hesitate to discover our exclusive list of net cash growth stocks, today.
We aim to bring you long-term focused research analysis driven by fundamental data. Note that our analysis may not factor in the latest price-sensitive company announcements or qualitative material.
If you spot an error that warrants correction, please contact the editor at editorial-team@simplywallst.com. This article by Simply Wall St is general in nature. It does not constitute a recommendation to buy or sell any stock, and does not take account of your objectives, or your financial situation. Simply Wall St has no position in the stocks mentioned. Thank you for reading.
About AIM:TND
Tandem Group
Designs, develops, distributes, and retails of sports, leisure, and mobility products in the United Kingdom.
Adequate balance sheet and slightly overvalued.
Market Insights

Community Narratives


