
Advertisement
- United Kingdom
- /
- Professional Services
- /
- LSE:ITRK
Should You Use Intertek Group's (LON:ITRK) Statutory Earnings To Analyse It?
It might be old fashioned, but we really like to invest in companies that make a profit, each and every year. That said, the current statutory profit is not always a good guide to a company's underlying profitability. In this article, we'll look at how useful this year's statutory profit is, when analysing Intertek Group (LON:ITRK).
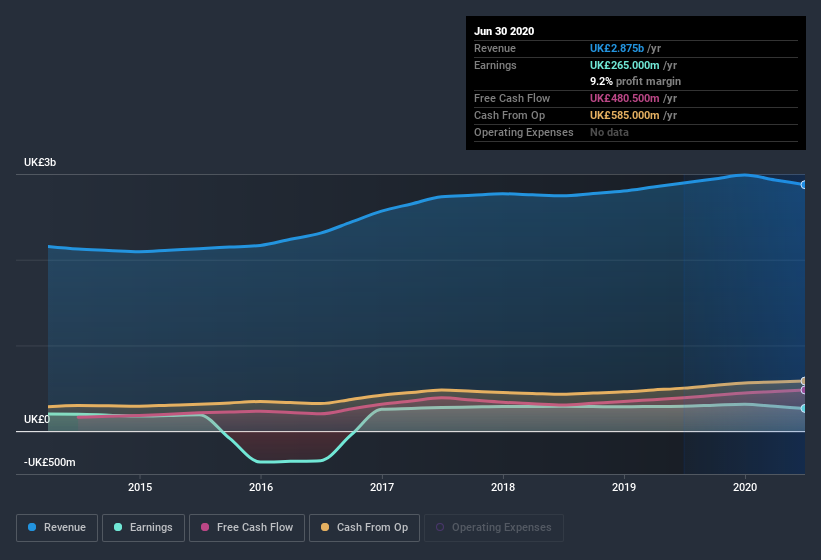
While Intertek Group was able to generate revenue of UK£2.88b in the last twelve months, we think its profit result of UK£265.0m was more important. While it managed to grow its revenue over the last three years, its profit has moved in the other direction, as you can see in the chart below.
View our latest analysis for Intertek Group
Of course, it is only sensible to look beyond the statutory profits and question how well those numbers represent the sustainable earnings power of the business. So today we'll look at what Intertek Group's cashflow tells us about the quality of its earnings. That might leave you wondering what analysts are forecasting in terms of future profitability. Luckily, you can click here to see an interactive graph depicting future profitability, based on their estimates.
Zooming In On Intertek Group's Earnings
Many investors haven't heard of the accrual ratio from cashflow, but it is actually a useful measure of how well a company's profit is backed up by free cash flow (FCF) during a given period. To get the accrual ratio we first subtract FCF from profit for a period, and then divide that number by the average operating assets for the period. You could think of the accrual ratio from cashflow as the 'non-FCF profit ratio'.
As a result, a negative accrual ratio is a positive for the company, and a positive accrual ratio is a negative. That is not intended to imply we should worry about a positive accrual ratio, but it's worth noting where the accrual ratio is rather high. That's because some academic studies have suggested that high accruals ratios tend to lead to lower profit or less profit growth.
Intertek Group has an accrual ratio of -0.13 for the year to June 2020. Therefore, its statutory earnings were quite a lot less than its free cashflow. In fact, it had free cash flow of UK£481m in the last year, which was a lot more than its statutory profit of UK£265.0m. Intertek Group's free cash flow improved over the last year, which is generally good to see.
Our Take On Intertek Group's Profit Performance
As we discussed above, Intertek Group has perfectly satisfactory free cash flow relative to profit. Because of this, we think Intertek Group's earnings potential is at least as good as it seems, and maybe even better! On the other hand, its EPS actually shrunk in the last twelve months. The goal of this article has been to assess how well we can rely on the statutory earnings to reflect the company's potential, but there is plenty more to consider. With this in mind, we wouldn't consider investing in a stock unless we had a thorough understanding of the risks. In terms of investment risks, we've identified 1 warning sign with Intertek Group, and understanding it should be part of your investment process.
This note has only looked at a single factor that sheds light on the nature of Intertek Group's profit. But there is always more to discover if you are capable of focussing your mind on minutiae. Some people consider a high return on equity to be a good sign of a quality business. So you may wish to see this free collection of companies boasting high return on equity, or this list of stocks that insiders are buying.
If you’re looking to trade Intertek Group, open an account with the lowest-cost* platform trusted by professionals, Interactive Brokers. Their clients from over 200 countries and territories trade stocks, options, futures, forex, bonds and funds worldwide from a single integrated account. Promoted
New: AI Stock Screener & Alerts
Our new AI Stock Screener scans the market every day to uncover opportunities.
• Dividend Powerhouses (3%+ Yield)
• Undervalued Small Caps with Insider Buying
• High growth Tech and AI Companies
Or build your own from over 50 metrics.
This article by Simply Wall St is general in nature. It does not constitute a recommendation to buy or sell any stock, and does not take account of your objectives, or your financial situation. We aim to bring you long-term focused analysis driven by fundamental data. Note that our analysis may not factor in the latest price-sensitive company announcements or qualitative material. Simply Wall St has no position in any stocks mentioned.
*Interactive Brokers Rated Lowest Cost Broker by StockBrokers.com Annual Online Review 2020
Have feedback on this article? Concerned about the content? Get in touch with us directly. Alternatively, email editorial-team (at) simplywallst.com.
About LSE:ITRK
Intertek Group
Provides quality assurance solutions to various industries in the United Kingdom, the United States, China, Australia, and internationally.
Outstanding track record, undervalued and pays a dividend.
Similar Companies
Market Insights

Advertisement
Community Narratives
MicroVision will explode future revenue by 380.37% with a vision towards success
Fair Value US$60.00|98.5% undervalued
TH
Community Contributor
The Indispensable Artery for a New North American Economy
Fair Value CA$132.87|2.3% undervalued
TI
Community Contributor