
Advertisement
- United Kingdom
- /
- Professional Services
- /
- AIM:NBB
Norman Broadbent plc (LON:NBB) Stock Rockets 67% But Many Are Still Ignoring The Company

Norman Broadbent plc (LON:NBB) shares have had a really impressive month, gaining 67% after a shaky period beforehand. Still, the 30-day jump doesn't change the fact that longer term shareholders have seen their stock decimated by the 52% share price drop in the last twelve months.
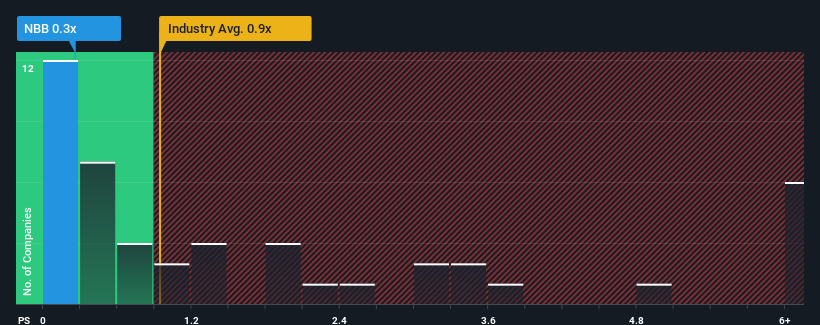
Although its price has surged higher, Norman Broadbent's price-to-sales (or "P/S") ratio of 0.3x might still make it look like a buy right now compared to the Professional Services industry in the United Kingdom, where around half of the companies have P/S ratios above 0.9x and even P/S above 4x are quite common. However, the P/S might be low for a reason and it requires further investigation to determine if it's justified.
We've discovered 2 warning signs about Norman Broadbent. View them for free.See our latest analysis for Norman Broadbent
What Does Norman Broadbent's Recent Performance Look Like?
As an illustration, revenue has deteriorated at Norman Broadbent over the last year, which is not ideal at all. Perhaps the market believes the recent revenue performance isn't good enough to keep up the industry, causing the P/S ratio to suffer. However, if this doesn't eventuate then existing shareholders may be feeling optimistic about the future direction of the share price.
Although there are no analyst estimates available for Norman Broadbent, take a look at this free data-rich visualisation to see how the company stacks up on earnings, revenue and cash flow.How Is Norman Broadbent's Revenue Growth Trending?
Norman Broadbent's P/S ratio would be typical for a company that's only expected to deliver limited growth, and importantly, perform worse than the industry.
Taking a look back first, the company's revenue growth last year wasn't something to get excited about as it posted a disappointing decline of 11%. However, a few very strong years before that means that it was still able to grow revenue by an impressive 67% in total over the last three years. Accordingly, while they would have preferred to keep the run going, shareholders would definitely welcome the medium-term rates of revenue growth.
Comparing that to the industry, which is only predicted to deliver 6.4% growth in the next 12 months, the company's momentum is stronger based on recent medium-term annualised revenue results.
With this in mind, we find it intriguing that Norman Broadbent's P/S isn't as high compared to that of its industry peers. It looks like most investors are not convinced the company can maintain its recent growth rates.
The Final Word
Norman Broadbent's stock price has surged recently, but its but its P/S still remains modest. We'd say the price-to-sales ratio's power isn't primarily as a valuation instrument but rather to gauge current investor sentiment and future expectations.
We're very surprised to see Norman Broadbent currently trading on a much lower than expected P/S since its recent three-year growth is higher than the wider industry forecast. When we see strong revenue with faster-than-industry growth, we assume there are some significant underlying risks to the company's ability to make money which is applying downwards pressure on the P/S ratio. It appears many are indeed anticipating revenue instability, because the persistence of these recent medium-term conditions would normally provide a boost to the share price.
It's always necessary to consider the ever-present spectre of investment risk. We've identified 2 warning signs with Norman Broadbent, and understanding these should be part of your investment process.
If companies with solid past earnings growth is up your alley, you may wish to see this free collection of other companies with strong earnings growth and low P/E ratios.
Valuation is complex, but we're here to simplify it.
Discover if Norman Broadbent might be undervalued or overvalued with our detailed analysis, featuring fair value estimates, potential risks, dividends, insider trades, and its financial condition.
Access Free AnalysisHave feedback on this article? Concerned about the content? Get in touch with us directly. Alternatively, email editorial-team (at) simplywallst.com.
This article by Simply Wall St is general in nature. We provide commentary based on historical data and analyst forecasts only using an unbiased methodology and our articles are not intended to be financial advice. It does not constitute a recommendation to buy or sell any stock, and does not take account of your objectives, or your financial situation. We aim to bring you long-term focused analysis driven by fundamental data. Note that our analysis may not factor in the latest price-sensitive company announcements or qualitative material. Simply Wall St has no position in any stocks mentioned.
About AIM:NBB
Norman Broadbent
Provides professional services in the United Kingdom and internationally.
Mediocre balance sheet very low.
Similar Companies
Market Insights

Advertisement
Community Narratives
Pinterest will surge as advertising innovations ignite revenue growth
Fair Value US$42.63|26.3% undervalued
BR
Community Contributor
Brambles' Revenue Set to Climb 14% with Profit Margins Following
Fair Value AU$21.90|4.8% overvalued
RO
Community Contributor
Challenging Future for STG as Organic Sales Decline by 8.8%
Fair Value DKK 116.13|26.8% undervalued
KA
Community Contributor