- United Kingdom
- /
- Professional Services
- /
- AIM:KGH
The Trends At Knights Group Holdings (LON:KGH) That You Should Know About


If you're not sure where to start when looking for the next multi-bagger, there are a few key trends you should keep an eye out for. In a perfect world, we'd like to see a company investing more capital into its business and ideally the returns earned from that capital are also increasing. Ultimately, this demonstrates that it's a business that is reinvesting profits at increasing rates of return. Although, when we looked at Knights Group Holdings (LON:KGH), it didn't seem to tick all of these boxes.
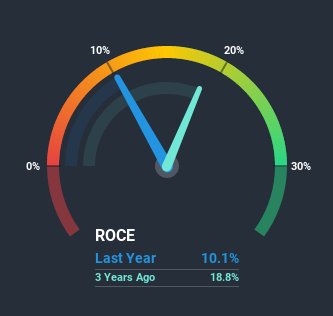
Understanding Return On Capital Employed (ROCE)
Just to clarify if you're unsure, ROCE is a metric for evaluating how much pre-tax income (in percentage terms) a company earns on the capital invested in its business. Analysts use this formula to calculate it for Knights Group Holdings:
Return on Capital Employed = Earnings Before Interest and Tax (EBIT) ÷ (Total Assets - Current Liabilities)
0.10 = UK£13m ÷ (UK£160m - UK£29m) (Based on the trailing twelve months to April 2020).
Therefore, Knights Group Holdings has an ROCE of 10%. That's a relatively normal return on capital, and it's around the 12% generated by the Professional Services industry.
View our latest analysis for Knights Group Holdings
In the above chart we have measured Knights Group Holdings' prior ROCE against its prior performance, but the future is arguably more important. If you're interested, you can view the analysts predictions in our free report on analyst forecasts for the company.
What The Trend Of ROCE Can Tell Us
The trend of ROCE doesn't look fantastic because it's fallen from 46% four years ago, while the business's capital employed increased by 1,438%. Usually this isn't ideal, but given Knights Group Holdings conducted a capital raising before their most recent earnings announcement, that would've likely contributed, at least partially, to the increased capital employed figure. The funds raised likely haven't been put to work yet so it's worth watching what happens in the future with Knights Group Holdings' earnings and if they change as a result from the capital raise.
On a side note, Knights Group Holdings has done well to pay down its current liabilities to 18% of total assets. Since the ratio used to be 75%, that's a significant reduction and it no doubt explains the drop in ROCE. What's more, this can reduce some aspects of risk to the business because now the company's suppliers or short-term creditors are funding less of its operations. Some would claim this reduces the business' efficiency at generating ROCE since it is now funding more of the operations with its own money.Our Take On Knights Group Holdings' ROCE
Even though returns on capital have fallen in the short term, we find it promising that revenue and capital employed have both increased for Knights Group Holdings. These trends don't appear to have influenced returns though, because the total return from the stock has been mostly flat over the last year. So we think it'd be worthwhile to look further into this stock given the trends look encouraging.
One more thing, we've spotted 3 warning signs facing Knights Group Holdings that you might find interesting.
While Knights Group Holdings may not currently earn the highest returns, we've compiled a list of companies that currently earn more than 25% return on equity. Check out this free list here.
If you’re looking to trade Knights Group Holdings, open an account with the lowest-cost* platform trusted by professionals, Interactive Brokers. Their clients from over 200 countries and territories trade stocks, options, futures, forex, bonds and funds worldwide from a single integrated account. Promoted
Valuation is complex, but we're here to simplify it.
Discover if Knights Group Holdings might be undervalued or overvalued with our detailed analysis, featuring fair value estimates, potential risks, dividends, insider trades, and its financial condition.
Access Free AnalysisThis article by Simply Wall St is general in nature. It does not constitute a recommendation to buy or sell any stock, and does not take account of your objectives, or your financial situation. We aim to bring you long-term focused analysis driven by fundamental data. Note that our analysis may not factor in the latest price-sensitive company announcements or qualitative material. Simply Wall St has no position in any stocks mentioned.
*Interactive Brokers Rated Lowest Cost Broker by StockBrokers.com Annual Online Review 2020
Have feedback on this article? Concerned about the content? Get in touch with us directly. Alternatively, email editorial-team (at) simplywallst.com.
About AIM:KGH
Knights Group Holdings
Provides legal and professional services in the United Kingdom.
Undervalued with excellent balance sheet.

