- United Kingdom
- /
- Professional Services
- /
- AIM:KGH
Some Investors May Be Worried About Knights Group Holdings' (LON:KGH) Returns On Capital


What are the early trends we should look for to identify a stock that could multiply in value over the long term? Ideally, a business will show two trends; firstly a growing return on capital employed (ROCE) and secondly, an increasing amount of capital employed. Put simply, these types of businesses are compounding machines, meaning they are continually reinvesting their earnings at ever-higher rates of return. Having said that, from a first glance at Knights Group Holdings (LON:KGH) we aren't jumping out of our chairs at how returns are trending, but let's have a deeper look.
Understanding Return On Capital Employed (ROCE)
For those who don't know, ROCE is a measure of a company's yearly pre-tax profit (its return), relative to the capital employed in the business. Analysts use this formula to calculate it for Knights Group Holdings:
Return on Capital Employed = Earnings Before Interest and Tax (EBIT) ÷ (Total Assets - Current Liabilities)
0.11 = UK£14m ÷ (UK£157m - UK£28m) (Based on the trailing twelve months to October 2020).
Thus, Knights Group Holdings has an ROCE of 11%. In absolute terms, that's a pretty normal return, and it's somewhat close to the Professional Services industry average of 13%.
See our latest analysis for Knights Group Holdings
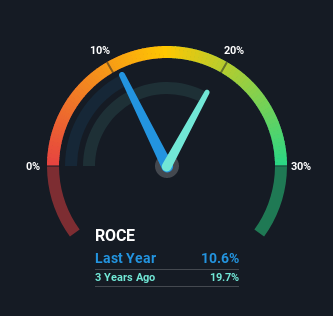
Above you can see how the current ROCE for Knights Group Holdings compares to its prior returns on capital, but there's only so much you can tell from the past. If you'd like, you can check out the forecasts from the analysts covering Knights Group Holdings here for free.
So How Is Knights Group Holdings' ROCE Trending?
The trend of ROCE doesn't look fantastic because it's fallen from 25% four years ago, while the business's capital employed increased by 558%. That being said, Knights Group Holdings raised some capital prior to their latest results being released, so that could partly explain the increase in capital employed. The funds raised likely haven't been put to work yet so it's worth watching what happens in the future with Knights Group Holdings' earnings and if they change as a result from the capital raise.
On a side note, Knights Group Holdings has done well to pay down its current liabilities to 18% of total assets. That could partly explain why the ROCE has dropped. What's more, this can reduce some aspects of risk to the business because now the company's suppliers or short-term creditors are funding less of its operations. Some would claim this reduces the business' efficiency at generating ROCE since it is now funding more of the operations with its own money.
The Key Takeaway
Even though returns on capital have fallen in the short term, we find it promising that revenue and capital employed have both increased for Knights Group Holdings. And the stock has followed suit returning a meaningful 15% to shareholders over the last year. So should these growth trends continue, we'd be optimistic on the stock going forward.
If you're still interested in Knights Group Holdings it's worth checking out our FREE intrinsic value approximation to see if it's trading at an attractive price in other respects.
If you want to search for solid companies with great earnings, check out this free list of companies with good balance sheets and impressive returns on equity.
When trading Knights Group Holdings or any other investment, use the platform considered by many to be the Professional's Gateway to the Worlds Market, Interactive Brokers. You get the lowest-cost* trading on stocks, options, futures, forex, bonds and funds worldwide from a single integrated account. Promoted
Valuation is complex, but we're here to simplify it.
Discover if Knights Group Holdings might be undervalued or overvalued with our detailed analysis, featuring fair value estimates, potential risks, dividends, insider trades, and its financial condition.
Access Free AnalysisThis article by Simply Wall St is general in nature. It does not constitute a recommendation to buy or sell any stock, and does not take account of your objectives, or your financial situation. We aim to bring you long-term focused analysis driven by fundamental data. Note that our analysis may not factor in the latest price-sensitive company announcements or qualitative material. Simply Wall St has no position in any stocks mentioned.
*Interactive Brokers Rated Lowest Cost Broker by StockBrokers.com Annual Online Review 2020
Have feedback on this article? Concerned about the content? Get in touch with us directly. Alternatively, email editorial-team (at) simplywallst.com.
About AIM:KGH
Knights Group Holdings
Provides legal and professional services in the United Kingdom.
Undervalued with excellent balance sheet.
