

The external fund manager backed by Berkshire Hathaway's Charlie Munger, Li Lu, makes no bones about it when he says 'The biggest investment risk is not the volatility of prices, but whether you will suffer a permanent loss of capital.' When we think about how risky a company is, we always like to look at its use of debt, since debt overload can lead to ruin. Importantly, IMI plc (LON:IMI) does carry debt. But the more important question is: how much risk is that debt creating?
What Risk Does Debt Bring?
Generally speaking, debt only becomes a real problem when a company can't easily pay it off, either by raising capital or with its own cash flow. Part and parcel of capitalism is the process of 'creative destruction' where failed businesses are mercilessly liquidated by their bankers. However, a more common (but still painful) scenario is that it has to raise new equity capital at a low price, thus permanently diluting shareholders. Of course, the upside of debt is that it often represents cheap capital, especially when it replaces dilution in a company with the ability to reinvest at high rates of return. When we examine debt levels, we first consider both cash and debt levels, together.
Check out our latest analysis for IMI
What Is IMI's Debt?
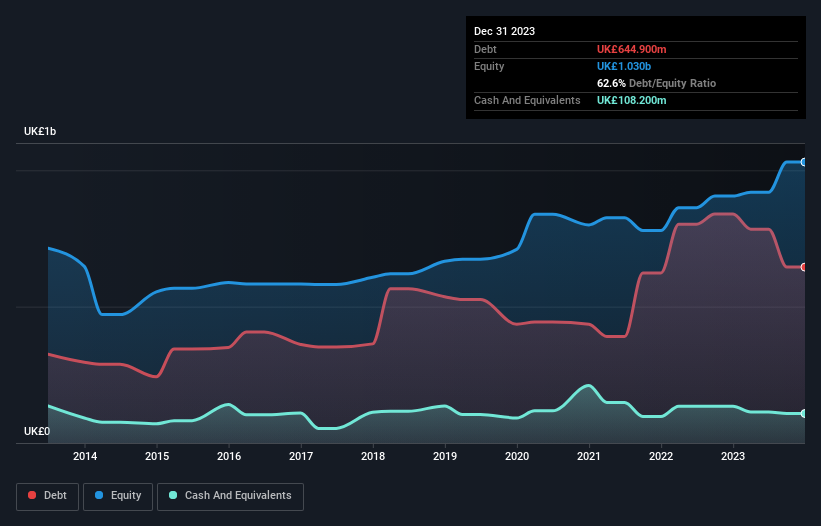
You can click the graphic below for the historical numbers, but it shows that IMI had UK£644.9m of debt in December 2023, down from UK£839.3m, one year before. On the flip side, it has UK£108.2m in cash leading to net debt of about UK£536.7m.
How Strong Is IMI's Balance Sheet?
Zooming in on the latest balance sheet data, we can see that IMI had liabilities of UK£721.6m due within 12 months and liabilities of UK£718.6m due beyond that. Offsetting this, it had UK£108.2m in cash and UK£503.8m in receivables that were due within 12 months. So its liabilities outweigh the sum of its cash and (near-term) receivables by UK£828.2m.
Since publicly traded IMI shares are worth a total of UK£4.83b, it seems unlikely that this level of liabilities would be a major threat. Having said that, it's clear that we should continue to monitor its balance sheet, lest it change for the worse.
We use two main ratios to inform us about debt levels relative to earnings. The first is net debt divided by earnings before interest, tax, depreciation, and amortization (EBITDA), while the second is how many times its earnings before interest and tax (EBIT) covers its interest expense (or its interest cover, for short). The advantage of this approach is that we take into account both the absolute quantum of debt (with net debt to EBITDA) and the actual interest expenses associated with that debt (with its interest cover ratio).
IMI has a low net debt to EBITDA ratio of only 1.2. And its EBIT covers its interest expense a whopping 16.3 times over. So you could argue it is no more threatened by its debt than an elephant is by a mouse. Fortunately, IMI grew its EBIT by 9.1% in the last year, making that debt load look even more manageable. When analysing debt levels, the balance sheet is the obvious place to start. But ultimately the future profitability of the business will decide if IMI can strengthen its balance sheet over time. So if you're focused on the future you can check out this free report showing analyst profit forecasts.
Finally, while the tax-man may adore accounting profits, lenders only accept cold hard cash. So we always check how much of that EBIT is translated into free cash flow. During the last three years, IMI produced sturdy free cash flow equating to 71% of its EBIT, about what we'd expect. This free cash flow puts the company in a good position to pay down debt, when appropriate.
Our View
Happily, IMI's impressive interest cover implies it has the upper hand on its debt. And the good news does not stop there, as its conversion of EBIT to free cash flow also supports that impression! Zooming out, IMI seems to use debt quite reasonably; and that gets the nod from us. After all, sensible leverage can boost returns on equity. There's no doubt that we learn most about debt from the balance sheet. However, not all investment risk resides within the balance sheet - far from it. Be aware that IMI is showing 1 warning sign in our investment analysis , you should know about...
Of course, if you're the type of investor who prefers buying stocks without the burden of debt, then don't hesitate to discover our exclusive list of net cash growth stocks, today.
If you're looking to trade IMI, open an account with the lowest-cost platform trusted by professionals, Interactive Brokers.
With clients in over 200 countries and territories, and access to 160 markets, IBKR lets you trade stocks, options, futures, forex, bonds and funds from a single integrated account.
Enjoy no hidden fees, no account minimums, and FX conversion rates as low as 0.03%, far better than what most brokers offer.
Sponsored ContentNew: AI Stock Screener & Alerts
Our new AI Stock Screener scans the market every day to uncover opportunities.
• Dividend Powerhouses (3%+ Yield)
• Undervalued Small Caps with Insider Buying
• High growth Tech and AI Companies
Or build your own from over 50 metrics.
Have feedback on this article? Concerned about the content? Get in touch with us directly. Alternatively, email editorial-team (at) simplywallst.com.
This article by Simply Wall St is general in nature. We provide commentary based on historical data and analyst forecasts only using an unbiased methodology and our articles are not intended to be financial advice. It does not constitute a recommendation to buy or sell any stock, and does not take account of your objectives, or your financial situation. We aim to bring you long-term focused analysis driven by fundamental data. Note that our analysis may not factor in the latest price-sensitive company announcements or qualitative material. Simply Wall St has no position in any stocks mentioned.
About LSE:IMI
IMI
An engineering company, engages in the design, manufacturing, and servicing of engineering products in the United Kingdom, Germany, rest of Europe, the United States, rest of the Americas, China, rest of the Asia Pacific, the Middle East, and Africa.
Very undervalued with solid track record.
Similar Companies
Market Insights

Community Narratives

