- United Kingdom
- /
- Construction
- /
- LSE:COST
Is There An Opportunity With Costain Group PLC's (LON:COST) 50% Undervaluation?


Key Insights
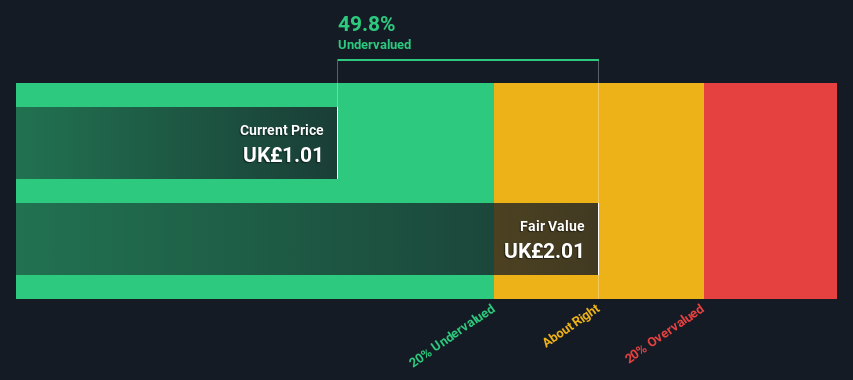
- Costain Group's estimated fair value is UK£2.01 based on 2 Stage Free Cash Flow to Equity
- Current share price of UK£1.01 suggests Costain Group is potentially 50% undervalued
- Our fair value estimate is 81% higher than Costain Group's analyst price target of UK£1.11
Today we will run through one way of estimating the intrinsic value of Costain Group PLC (LON:COST) by estimating the company's future cash flows and discounting them to their present value. We will use the Discounted Cash Flow (DCF) model on this occasion. It may sound complicated, but actually it is quite simple!
We would caution that there are many ways of valuing a company and, like the DCF, each technique has advantages and disadvantages in certain scenarios. Anyone interested in learning a bit more about intrinsic value should have a read of the Simply Wall St analysis model.
See our latest analysis for Costain Group
The Calculation
We use what is known as a 2-stage model, which simply means we have two different periods of growth rates for the company's cash flows. Generally the first stage is higher growth, and the second stage is a lower growth phase. To start off with, we need to estimate the next ten years of cash flows. Where possible we use analyst estimates, but when these aren't available we extrapolate the previous free cash flow (FCF) from the last estimate or reported value. We assume companies with shrinking free cash flow will slow their rate of shrinkage, and that companies with growing free cash flow will see their growth rate slow, over this period. We do this to reflect that growth tends to slow more in the early years than it does in later years.
A DCF is all about the idea that a dollar in the future is less valuable than a dollar today, so we need to discount the sum of these future cash flows to arrive at a present value estimate:
10-year free cash flow (FCF) estimate
| 2025 | 2026 | 2027 | 2028 | 2029 | 2030 | 2031 | 2032 | 2033 | 2034 | |
| Levered FCF (£, Millions) | UK£33.3m | UK£32.1m | UK£31.6m | UK£31.3m | UK£31.4m | UK£31.6m | UK£31.9m | UK£32.3m | UK£32.8m | UK£33.3m |
| Growth Rate Estimate Source | Analyst x3 | Analyst x3 | Est @ -1.81% | Est @ -0.69% | Est @ 0.10% | Est @ 0.65% | Est @ 1.03% | Est @ 1.30% | Est @ 1.49% | Est @ 1.62% |
| Present Value (£, Millions) Discounted @ 7.1% | UK£31.2 | UK£28.0 | UK£25.7 | UK£23.9 | UK£22.3 | UK£21.0 | UK£19.8 | UK£18.7 | UK£17.8 | UK£16.9 |
("Est" = FCF growth rate estimated by Simply Wall St)
Present Value of 10-year Cash Flow (PVCF) = UK£225m
The second stage is also known as Terminal Value, this is the business's cash flow after the first stage. The Gordon Growth formula is used to calculate Terminal Value at a future annual growth rate equal to the 5-year average of the 10-year government bond yield of 1.9%. We discount the terminal cash flows to today's value at a cost of equity of 7.1%.
Terminal Value (TV)= FCF2034 × (1 + g) ÷ (r – g) = UK£33m× (1 + 1.9%) ÷ (7.1%– 1.9%) = UK£663m
Present Value of Terminal Value (PVTV)= TV / (1 + r)10= UK£663m÷ ( 1 + 7.1%)10= UK£335m
The total value is the sum of cash flows for the next ten years plus the discounted terminal value, which results in the Total Equity Value, which in this case is UK£561m. To get the intrinsic value per share, we divide this by the total number of shares outstanding. Relative to the current share price of UK£1.0, the company appears quite good value at a 50% discount to where the stock price trades currently. Valuations are imprecise instruments though, rather like a telescope - move a few degrees and end up in a different galaxy. Do keep this in mind.
Important Assumptions
Now the most important inputs to a discounted cash flow are the discount rate, and of course, the actual cash flows. You don't have to agree with these inputs, I recommend redoing the calculations yourself and playing with them. The DCF also does not consider the possible cyclicality of an industry, or a company's future capital requirements, so it does not give a full picture of a company's potential performance. Given that we are looking at Costain Group as potential shareholders, the cost of equity is used as the discount rate, rather than the cost of capital (or weighted average cost of capital, WACC) which accounts for debt. In this calculation we've used 7.1%, which is based on a levered beta of 1.056. Beta is a measure of a stock's volatility, compared to the market as a whole. We get our beta from the industry average beta of globally comparable companies, with an imposed limit between 0.8 and 2.0, which is a reasonable range for a stable business.
SWOT Analysis for Costain Group
- Currently debt free.
- Dividends are covered by earnings and cash flows.
- Earnings declined over the past year.
- Dividend is low compared to the top 25% of dividend payers in the Construction market.
- Annual earnings are forecast to grow faster than the British market.
- Good value based on P/E ratio and estimated fair value.
- Annual revenue is expected to decline over the next 3 years.
Looking Ahead:
Whilst important, the DCF calculation shouldn't be the only metric you look at when researching a company. The DCF model is not a perfect stock valuation tool. Preferably you'd apply different cases and assumptions and see how they would impact the company's valuation. For example, changes in the company's cost of equity or the risk free rate can significantly impact the valuation. Can we work out why the company is trading at a discount to intrinsic value? For Costain Group, we've put together three fundamental aspects you should consider:
- Risks: As an example, we've found 1 warning sign for Costain Group that you need to consider before investing here.
- Future Earnings: How does COST's growth rate compare to its peers and the wider market? Dig deeper into the analyst consensus number for the upcoming years by interacting with our free analyst growth expectation chart.
- Other Solid Businesses: Low debt, high returns on equity and good past performance are fundamental to a strong business. Why not explore our interactive list of stocks with solid business fundamentals to see if there are other companies you may not have considered!
PS. Simply Wall St updates its DCF calculation for every British stock every day, so if you want to find the intrinsic value of any other stock just search here.
New: AI Stock Screener & Alerts
Our new AI Stock Screener scans the market every day to uncover opportunities.
• Dividend Powerhouses (3%+ Yield)
• Undervalued Small Caps with Insider Buying
• High growth Tech and AI Companies
Or build your own from over 50 metrics.
Have feedback on this article? Concerned about the content? Get in touch with us directly. Alternatively, email editorial-team (at) simplywallst.com.
This article by Simply Wall St is general in nature. We provide commentary based on historical data and analyst forecasts only using an unbiased methodology and our articles are not intended to be financial advice. It does not constitute a recommendation to buy or sell any stock, and does not take account of your objectives, or your financial situation. We aim to bring you long-term focused analysis driven by fundamental data. Note that our analysis may not factor in the latest price-sensitive company announcements or qualitative material. Simply Wall St has no position in any stocks mentioned.
About LSE:COST
Costain Group
Provides smart infrastructure solutions for the transportation, energy, water, and defense markets in the United Kingdom.
Flawless balance sheet and undervalued.
Similar Companies
Market Insights

Community Narratives


