
Advertisement

Key Insights
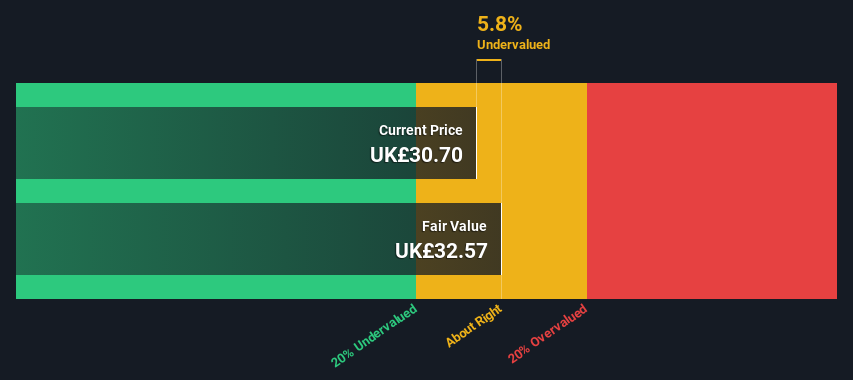
- Using the 2 Stage Free Cash Flow to Equity, Bunzl fair value estimate is UK£32.57
- Current share price of UK£30.70 suggests Bunzl is potentially trading close to its fair value
- The UK£31.75 analyst price target for BNZL is 2.5% less than our estimate of fair value
In this article we are going to estimate the intrinsic value of Bunzl plc (LON:BNZL) by projecting its future cash flows and then discounting them to today's value. This will be done using the Discounted Cash Flow (DCF) model. Before you think you won't be able to understand it, just read on! It's actually much less complex than you'd imagine.
We generally believe that a company's value is the present value of all of the cash it will generate in the future. However, a DCF is just one valuation metric among many, and it is not without flaws. Anyone interested in learning a bit more about intrinsic value should have a read of the Simply Wall St analysis model.
View our latest analysis for Bunzl
Step By Step Through The Calculation
We're using the 2-stage growth model, which simply means we take in account two stages of company's growth. In the initial period the company may have a higher growth rate and the second stage is usually assumed to have a stable growth rate. In the first stage we need to estimate the cash flows to the business over the next ten years. Where possible we use analyst estimates, but when these aren't available we extrapolate the previous free cash flow (FCF) from the last estimate or reported value. We assume companies with shrinking free cash flow will slow their rate of shrinkage, and that companies with growing free cash flow will see their growth rate slow, over this period. We do this to reflect that growth tends to slow more in the early years than it does in later years.
A DCF is all about the idea that a dollar in the future is less valuable than a dollar today, so we discount the value of these future cash flows to their estimated value in today's dollars:
10-year free cash flow (FCF) estimate
| 2024 | 2025 | 2026 | 2027 | 2028 | 2029 | 2030 | 2031 | 2032 | 2033 | |
| Levered FCF (£, Millions) | UK£665.3m | UK£676.5m | UK£699.2m | UK£723.0m | UK£757.0m | UK£780.7m | UK£801.9m | UK£821.5m | UK£839.9m | UK£857.5m |
| Growth Rate Estimate Source | Analyst x9 | Analyst x9 | Analyst x9 | Analyst x1 | Analyst x1 | Est @ 3.13% | Est @ 2.72% | Est @ 2.44% | Est @ 2.24% | Est @ 2.10% |
| Present Value (£, Millions) Discounted @ 8.3% | UK£614 | UK£577 | UK£550 | UK£525 | UK£508 | UK£484 | UK£459 | UK£434 | UK£409 | UK£386 |
("Est" = FCF growth rate estimated by Simply Wall St)
Present Value of 10-year Cash Flow (PVCF) = UK£4.9b
We now need to calculate the Terminal Value, which accounts for all the future cash flows after this ten year period. For a number of reasons a very conservative growth rate is used that cannot exceed that of a country's GDP growth. In this case we have used the 5-year average of the 10-year government bond yield (1.8%) to estimate future growth. In the same way as with the 10-year 'growth' period, we discount future cash flows to today's value, using a cost of equity of 8.3%.
Terminal Value (TV)= FCF2033 × (1 + g) ÷ (r – g) = UK£857m× (1 + 1.8%) ÷ (8.3%– 1.8%) = UK£13b
Present Value of Terminal Value (PVTV)= TV / (1 + r)10= UK£13b÷ ( 1 + 8.3%)10= UK£6.0b
The total value is the sum of cash flows for the next ten years plus the discounted terminal value, which results in the Total Equity Value, which in this case is UK£11b. In the final step we divide the equity value by the number of shares outstanding. Compared to the current share price of UK£30.7, the company appears about fair value at a 5.8% discount to where the stock price trades currently. The assumptions in any calculation have a big impact on the valuation, so it is better to view this as a rough estimate, not precise down to the last cent.
Important Assumptions
We would point out that the most important inputs to a discounted cash flow are the discount rate and of course the actual cash flows. If you don't agree with these result, have a go at the calculation yourself and play with the assumptions. The DCF also does not consider the possible cyclicality of an industry, or a company's future capital requirements, so it does not give a full picture of a company's potential performance. Given that we are looking at Bunzl as potential shareholders, the cost of equity is used as the discount rate, rather than the cost of capital (or weighted average cost of capital, WACC) which accounts for debt. In this calculation we've used 8.3%, which is based on a levered beta of 1.194. Beta is a measure of a stock's volatility, compared to the market as a whole. We get our beta from the industry average beta of globally comparable companies, with an imposed limit between 0.8 and 2.0, which is a reasonable range for a stable business.
SWOT Analysis for Bunzl
Strength
- Earnings growth over the past year exceeded the industry.
- Debt is not viewed as a risk.
- Dividends are covered by earnings and cash flows.
Weakness
- Dividend is low compared to the top 25% of dividend payers in the Trade Distributors market.
Opportunity
- Annual earnings are forecast to grow for the next 3 years.
- Good value based on P/E ratio and estimated fair value.
Threat
- Annual earnings are forecast to grow slower than the British market.
Moving On:
Whilst important, the DCF calculation ideally won't be the sole piece of analysis you scrutinize for a company. It's not possible to obtain a foolproof valuation with a DCF model. Rather it should be seen as a guide to "what assumptions need to be true for this stock to be under/overvalued?" If a company grows at a different rate, or if its cost of equity or risk free rate changes sharply, the output can look very different. For Bunzl, we've put together three essential factors you should assess:
- Risks: Case in point, we've spotted 1 warning sign for Bunzl you should be aware of.
- Future Earnings: How does BNZL's growth rate compare to its peers and the wider market? Dig deeper into the analyst consensus number for the upcoming years by interacting with our free analyst growth expectation chart.
- Other High Quality Alternatives: Do you like a good all-rounder? Explore our interactive list of high quality stocks to get an idea of what else is out there you may be missing!
PS. The Simply Wall St app conducts a discounted cash flow valuation for every stock on the LSE every day. If you want to find the calculation for other stocks just search here.
Valuation is complex, but we're here to simplify it.
Discover if Bunzl might be undervalued or overvalued with our detailed analysis, featuring fair value estimates, potential risks, dividends, insider trades, and its financial condition.
Access Free AnalysisHave feedback on this article? Concerned about the content? Get in touch with us directly. Alternatively, email editorial-team (at) simplywallst.com.
This article by Simply Wall St is general in nature. We provide commentary based on historical data and analyst forecasts only using an unbiased methodology and our articles are not intended to be financial advice. It does not constitute a recommendation to buy or sell any stock, and does not take account of your objectives, or your financial situation. We aim to bring you long-term focused analysis driven by fundamental data. Note that our analysis may not factor in the latest price-sensitive company announcements or qualitative material. Simply Wall St has no position in any stocks mentioned.
Have feedback on this article? Concerned about the content? Get in touch with us directly. Alternatively, email editorial-team@simplywallst.com
About LSE:BNZL
Bunzl
Operates as a distribution and services company in the North America, Continental Europe, the United Kingdom, Ireland, and internationally.
Adequate balance sheet second-rate dividend payer.
Similar Companies
Market Insights

Advertisement
Community Narratives
SSAB in pole position when it comes to the combination of steel tariffs and the EU's investment drive
Fair Value SEK 86.87|32.1% undervalued
PI
Community Contributor
The Future of Lennar and Homebuilding Faces Short Term Challenges with Potential for Long Term Growth
Fair Value US$162.49|34.7% undervalued
ZE
Community Contributor
Saudi Aramco (SASE:2222): Not The Sexiest High Dividend Yield Stock, But One With Interesting 'Convertible-Like' Qualities
Fair Value ر.س37.02|30.2% undervalued
EV
Community Contributor