- United Kingdom
- /
- Aerospace & Defense
- /
- LSE:BAB
Despite lower earnings than a year ago, Babcock International Group (LON:BAB) investors are up 68% since then


The simplest way to invest in stocks is to buy exchange traded funds. But one can do better than that by picking better than average stocks (as part of a diversified portfolio). To wit, the Babcock International Group PLC (LON:BAB) share price is 67% higher than it was a year ago, much better than the market return of around 0.03% (not including dividends) in the same period. If it can keep that out-performance up over the long term, investors will do very well! It is also impressive that the stock is up 57% over three years, adding to the sense that it is a real winner.
While this past week has detracted from the company's one-year return, let's look at the recent trends of the underlying business and see if the gains have been in alignment.
See our latest analysis for Babcock International Group
To quote Buffett, 'Ships will sail around the world but the Flat Earth Society will flourish. There will continue to be wide discrepancies between price and value in the marketplace...' One imperfect but simple way to consider how the market perception of a company has shifted is to compare the change in the earnings per share (EPS) with the share price movement.
During the last year Babcock International Group grew its earnings per share, moving from a loss to a profit.
When a company has just transitioned to profitability, earnings per share growth is not always the best way to look at the share price action.
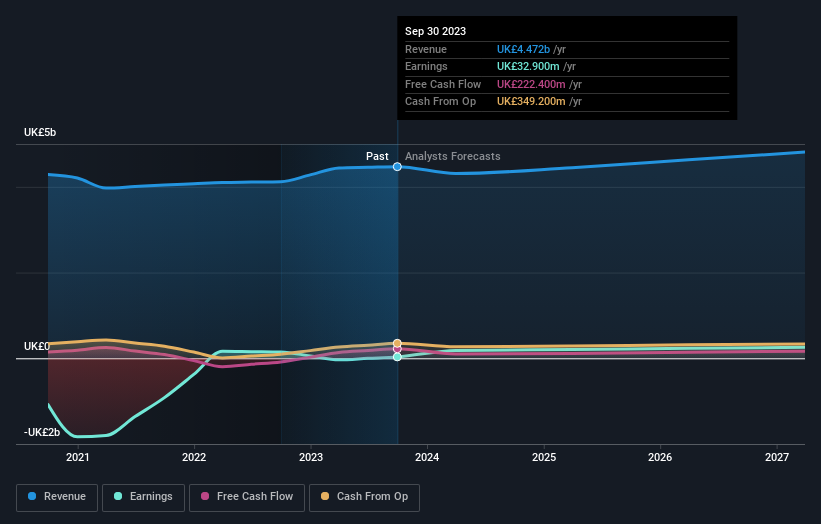
We are skeptical of the suggestion that the 0.7% dividend yield would entice buyers to the stock. We think that the revenue growth of 8.5% could have some investors interested. We do see some companies suppress earnings in order to accelerate revenue growth.
You can see below how earnings and revenue have changed over time (discover the exact values by clicking on the image).
It is of course excellent to see how Babcock International Group has grown profits over the years, but the future is more important for shareholders. You can see how its balance sheet has strengthened (or weakened) over time in this free interactive graphic.
A Different Perspective
We're pleased to report that Babcock International Group shareholders have received a total shareholder return of 68% over one year. That's including the dividend. That's better than the annualised return of 0.4% over half a decade, implying that the company is doing better recently. In the best case scenario, this may hint at some real business momentum, implying that now could be a great time to delve deeper. While it is well worth considering the different impacts that market conditions can have on the share price, there are other factors that are even more important. Consider risks, for instance. Every company has them, and we've spotted 3 warning signs for Babcock International Group you should know about.
For those who like to find winning investments this free list of growing companies with recent insider purchasing, could be just the ticket.
Please note, the market returns quoted in this article reflect the market weighted average returns of stocks that currently trade on British exchanges.
Valuation is complex, but we're here to simplify it.
Discover if Babcock International Group might be undervalued or overvalued with our detailed analysis, featuring fair value estimates, potential risks, dividends, insider trades, and its financial condition.
Access Free AnalysisHave feedback on this article? Concerned about the content? Get in touch with us directly. Alternatively, email editorial-team (at) simplywallst.com.
This article by Simply Wall St is general in nature. We provide commentary based on historical data and analyst forecasts only using an unbiased methodology and our articles are not intended to be financial advice. It does not constitute a recommendation to buy or sell any stock, and does not take account of your objectives, or your financial situation. We aim to bring you long-term focused analysis driven by fundamental data. Note that our analysis may not factor in the latest price-sensitive company announcements or qualitative material. Simply Wall St has no position in any stocks mentioned.
About LSE:BAB
Babcock International Group
Engages in the design, development, manufacture, and integration of specialist systems for aerospace, defense, and security in the United Kingdom, rest of Europe, Africa, North America, Australasia, and internationally.
Very undervalued with solid track record.

