- United Kingdom
- /
- Trade Distributors
- /
- LSE:AHT
These 4 Measures Indicate That Ashtead Group (LON:AHT) Is Using Debt Reasonably Well


Some say volatility, rather than debt, is the best way to think about risk as an investor, but Warren Buffett famously said that 'Volatility is far from synonymous with risk.' When we think about how risky a company is, we always like to look at its use of debt, since debt overload can lead to ruin. We can see that Ashtead Group plc (LON:AHT) does use debt in its business. But is this debt a concern to shareholders?
Why Does Debt Bring Risk?
Debt and other liabilities become risky for a business when it cannot easily fulfill those obligations, either with free cash flow or by raising capital at an attractive price. If things get really bad, the lenders can take control of the business. However, a more frequent (but still costly) occurrence is where a company must issue shares at bargain-basement prices, permanently diluting shareholders, just to shore up its balance sheet. By replacing dilution, though, debt can be an extremely good tool for businesses that need capital to invest in growth at high rates of return. The first step when considering a company's debt levels is to consider its cash and debt together.
Our analysis indicates that AHT is potentially undervalued!
What Is Ashtead Group's Debt?
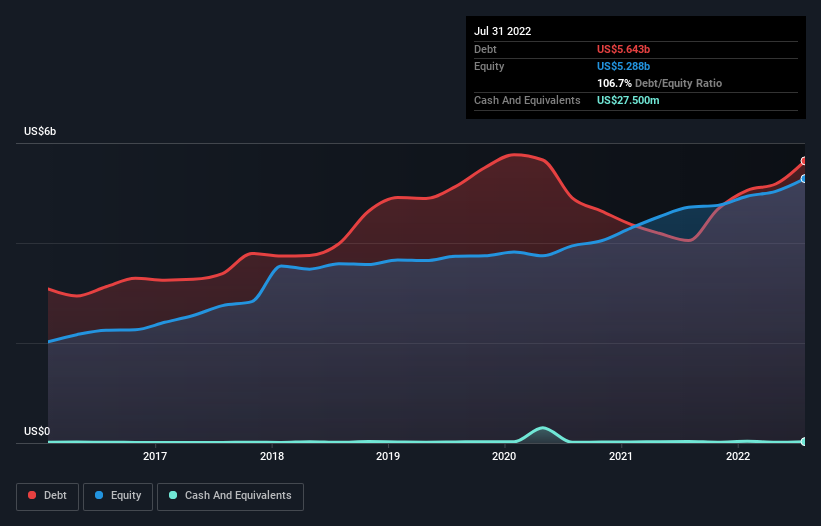
The image below, which you can click on for greater detail, shows that at July 2022 Ashtead Group had debt of US$5.64b, up from US$4.05b in one year. And it doesn't have much cash, so its net debt is about the same.
A Look At Ashtead Group's Liabilities
The latest balance sheet data shows that Ashtead Group had liabilities of US$1.48b due within a year, and liabilities of US$9.44b falling due after that. Offsetting this, it had US$27.5m in cash and US$1.60b in receivables that were due within 12 months. So it has liabilities totalling US$9.29b more than its cash and near-term receivables, combined.
While this might seem like a lot, it is not so bad since Ashtead Group has a huge market capitalization of US$22.7b, and so it could probably strengthen its balance sheet by raising capital if it needed to. However, it is still worthwhile taking a close look at its ability to pay off debt.
We use two main ratios to inform us about debt levels relative to earnings. The first is net debt divided by earnings before interest, tax, depreciation, and amortization (EBITDA), while the second is how many times its earnings before interest and tax (EBIT) covers its interest expense (or its interest cover, for short). The advantage of this approach is that we take into account both the absolute quantum of debt (with net debt to EBITDA) and the actual interest expenses associated with that debt (with its interest cover ratio).
With a debt to EBITDA ratio of 1.5, Ashtead Group uses debt artfully but responsibly. And the alluring interest cover (EBIT of 7.2 times interest expense) certainly does not do anything to dispel this impression. Also positive, Ashtead Group grew its EBIT by 24% in the last year, and that should make it easier to pay down debt, going forward. The balance sheet is clearly the area to focus on when you are analysing debt. But it is future earnings, more than anything, that will determine Ashtead Group's ability to maintain a healthy balance sheet going forward. So if you're focused on the future you can check out this free report showing analyst profit forecasts.
Finally, a business needs free cash flow to pay off debt; accounting profits just don't cut it. So it's worth checking how much of that EBIT is backed by free cash flow. During the last three years, Ashtead Group produced sturdy free cash flow equating to 73% of its EBIT, about what we'd expect. This cold hard cash means it can reduce its debt when it wants to.
Our View
Happily, Ashtead Group's impressive conversion of EBIT to free cash flow implies it has the upper hand on its debt. And the good news does not stop there, as its EBIT growth rate also supports that impression! When we consider the range of factors above, it looks like Ashtead Group is pretty sensible with its use of debt. That means they are taking on a bit more risk, in the hope of boosting shareholder returns. The balance sheet is clearly the area to focus on when you are analysing debt. But ultimately, every company can contain risks that exist outside of the balance sheet. We've identified 1 warning sign with Ashtead Group , and understanding them should be part of your investment process.
If you're interested in investing in businesses that can grow profits without the burden of debt, then check out this free list of growing businesses that have net cash on the balance sheet.
If you're looking to trade Ashtead Group, open an account with the lowest-cost platform trusted by professionals, Interactive Brokers.
With clients in over 200 countries and territories, and access to 160 markets, IBKR lets you trade stocks, options, futures, forex, bonds and funds from a single integrated account.
Enjoy no hidden fees, no account minimums, and FX conversion rates as low as 0.03%, far better than what most brokers offer.
Sponsored ContentNew: Manage All Your Stock Portfolios in One Place
We've created the ultimate portfolio companion for stock investors, and it's free.
• Connect an unlimited number of Portfolios and see your total in one currency
• Be alerted to new Warning Signs or Risks via email or mobile
• Track the Fair Value of your stocks
Have feedback on this article? Concerned about the content? Get in touch with us directly. Alternatively, email editorial-team (at) simplywallst.com.
This article by Simply Wall St is general in nature. We provide commentary based on historical data and analyst forecasts only using an unbiased methodology and our articles are not intended to be financial advice. It does not constitute a recommendation to buy or sell any stock, and does not take account of your objectives, or your financial situation. We aim to bring you long-term focused analysis driven by fundamental data. Note that our analysis may not factor in the latest price-sensitive company announcements or qualitative material. Simply Wall St has no position in any stocks mentioned.
About LSE:AHT
Ashtead Group
Engages in the construction, industrial, and general equipment rental business under the Sunbelt Rentals brand name in the United States, the United Kingdom, and Canada.
Established dividend payer and good value.
Similar Companies
Market Insights

Community Narratives

