- United Kingdom
- /
- Trade Distributors
- /
- LSE:AHT
Estimating The Intrinsic Value Of Ashtead Group plc (LON:AHT)


Key Insights
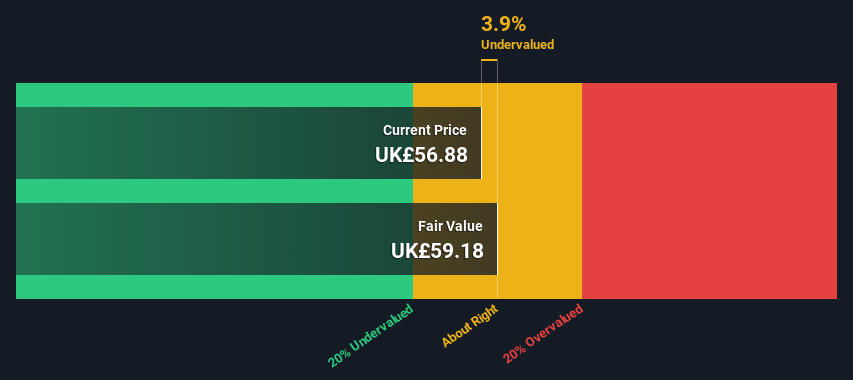
- The projected fair value for Ashtead Group is UK£59.18 based on 2 Stage Free Cash Flow to Equity
- Current share price of UK£56.88 suggests Ashtead Group is potentially trading close to its fair value
- The US$62.99 analyst price target for AHT is 6.4% more than our estimate of fair value
Today we'll do a simple run through of a valuation method used to estimate the attractiveness of Ashtead Group plc (LON:AHT) as an investment opportunity by estimating the company's future cash flows and discounting them to their present value. Our analysis will employ the Discounted Cash Flow (DCF) model. There's really not all that much to it, even though it might appear quite complex.
Remember though, that there are many ways to estimate a company's value, and a DCF is just one method. Anyone interested in learning a bit more about intrinsic value should have a read of the Simply Wall St analysis model.
Check out our latest analysis for Ashtead Group
The Method
We use what is known as a 2-stage model, which simply means we have two different periods of growth rates for the company's cash flows. Generally the first stage is higher growth, and the second stage is a lower growth phase. To start off with, we need to estimate the next ten years of cash flows. Where possible we use analyst estimates, but when these aren't available we extrapolate the previous free cash flow (FCF) from the last estimate or reported value. We assume companies with shrinking free cash flow will slow their rate of shrinkage, and that companies with growing free cash flow will see their growth rate slow, over this period. We do this to reflect that growth tends to slow more in the early years than it does in later years.
A DCF is all about the idea that a dollar in the future is less valuable than a dollar today, so we need to discount the sum of these future cash flows to arrive at a present value estimate:
10-year free cash flow (FCF) forecast
| 2024 | 2025 | 2026 | 2027 | 2028 | 2029 | 2030 | 2031 | 2032 | 2033 | |
| Levered FCF ($, Millions) | US$273.6m | US$1.35b | US$1.47b | US$1.22b | US$1.94b | US$2.34b | US$2.63b | US$2.88b | US$3.08b | US$3.25b |
| Growth Rate Estimate Source | Analyst x4 | Analyst x5 | Analyst x5 | Analyst x2 | Analyst x2 | Analyst x1 | Est @ 12.51% | Est @ 9.29% | Est @ 7.03% | Est @ 5.45% |
| Present Value ($, Millions) Discounted @ 8.6% | US$252 | US$1.1k | US$1.1k | US$875 | US$1.3k | US$1.4k | US$1.5k | US$1.5k | US$1.5k | US$1.4k |
("Est" = FCF growth rate estimated by Simply Wall St)
Present Value of 10-year Cash Flow (PVCF) = US$12b
The second stage is also known as Terminal Value, this is the business's cash flow after the first stage. The Gordon Growth formula is used to calculate Terminal Value at a future annual growth rate equal to the 5-year average of the 10-year government bond yield of 1.8%. We discount the terminal cash flows to today's value at a cost of equity of 8.6%.
Terminal Value (TV)= FCF2033 × (1 + g) ÷ (r – g) = US$3.2b× (1 + 1.8%) ÷ (8.6%– 1.8%) = US$48b
Present Value of Terminal Value (PVTV)= TV / (1 + r)10= US$48b÷ ( 1 + 8.6%)10= US$21b
The total value, or equity value, is then the sum of the present value of the future cash flows, which in this case is US$33b. In the final step we divide the equity value by the number of shares outstanding. Compared to the current share price of UK£56.9, the company appears about fair value at a 3.9% discount to where the stock price trades currently. The assumptions in any calculation have a big impact on the valuation, so it is better to view this as a rough estimate, not precise down to the last cent.
The Assumptions
The calculation above is very dependent on two assumptions. The first is the discount rate and the other is the cash flows. You don't have to agree with these inputs, I recommend redoing the calculations yourself and playing with them. The DCF also does not consider the possible cyclicality of an industry, or a company's future capital requirements, so it does not give a full picture of a company's potential performance. Given that we are looking at Ashtead Group as potential shareholders, the cost of equity is used as the discount rate, rather than the cost of capital (or weighted average cost of capital, WACC) which accounts for debt. In this calculation we've used 8.6%, which is based on a levered beta of 1.254. Beta is a measure of a stock's volatility, compared to the market as a whole. We get our beta from the industry average beta of globally comparable companies, with an imposed limit between 0.8 and 2.0, which is a reasonable range for a stable business.
SWOT Analysis for Ashtead Group
- Earnings growth over the past year exceeded the industry.
- Debt is well covered by earnings.
- Earnings growth over the past year is below its 5-year average.
- Dividend is low compared to the top 25% of dividend payers in the Trade Distributors market.
- Annual revenue is forecast to grow faster than the British market.
- Good value based on P/E ratio and estimated fair value.
- Debt is not well covered by operating cash flow.
- Paying a dividend but company has no free cash flows.
- Annual earnings are forecast to grow slower than the British market.
Moving On:
Whilst important, the DCF calculation shouldn't be the only metric you look at when researching a company. It's not possible to obtain a foolproof valuation with a DCF model. Instead the best use for a DCF model is to test certain assumptions and theories to see if they would lead to the company being undervalued or overvalued. For example, changes in the company's cost of equity or the risk free rate can significantly impact the valuation. For Ashtead Group, there are three fundamental aspects you should consider:
- Risks: Consider for instance, the ever-present spectre of investment risk. We've identified 1 warning sign with Ashtead Group , and understanding it should be part of your investment process.
- Future Earnings: How does AHT's growth rate compare to its peers and the wider market? Dig deeper into the analyst consensus number for the upcoming years by interacting with our free analyst growth expectation chart.
- Other Solid Businesses: Low debt, high returns on equity and good past performance are fundamental to a strong business. Why not explore our interactive list of stocks with solid business fundamentals to see if there are other companies you may not have considered!
PS. The Simply Wall St app conducts a discounted cash flow valuation for every stock on the LSE every day. If you want to find the calculation for other stocks just search here.
New: Manage All Your Stock Portfolios in One Place
We've created the ultimate portfolio companion for stock investors, and it's free.
• Connect an unlimited number of Portfolios and see your total in one currency
• Be alerted to new Warning Signs or Risks via email or mobile
• Track the Fair Value of your stocks
Have feedback on this article? Concerned about the content? Get in touch with us directly. Alternatively, email editorial-team (at) simplywallst.com.
This article by Simply Wall St is general in nature. We provide commentary based on historical data and analyst forecasts only using an unbiased methodology and our articles are not intended to be financial advice. It does not constitute a recommendation to buy or sell any stock, and does not take account of your objectives, or your financial situation. We aim to bring you long-term focused analysis driven by fundamental data. Note that our analysis may not factor in the latest price-sensitive company announcements or qualitative material. Simply Wall St has no position in any stocks mentioned.
About LSE:AHT
Ashtead Group
Engages in the construction, industrial, and general equipment rental business under the Sunbelt Rentals brand name in the United States, the United Kingdom, and Canada.
Average dividend payer and fair value.

