- United Kingdom
- /
- Construction
- /
- AIM:NEXS
Reflecting on Nexus Infrastructure's (LON:NEXS) Share Price Returns Over The Last Three Years

Nexus Infrastructure plc (LON:NEXS) shareholders should be happy to see the share price up 21% in the last month. But that doesn't help the fact that the three year return is less impressive. Truth be told the share price declined 27% in three years and that return, Dear Reader, falls short of what you could have got from passive investing with an index fund.
See our latest analysis for Nexus Infrastructure
While the efficient markets hypothesis continues to be taught by some, it has been proven that markets are over-reactive dynamic systems, and investors are not always rational. One flawed but reasonable way to assess how sentiment around a company has changed is to compare the earnings per share (EPS) with the share price.
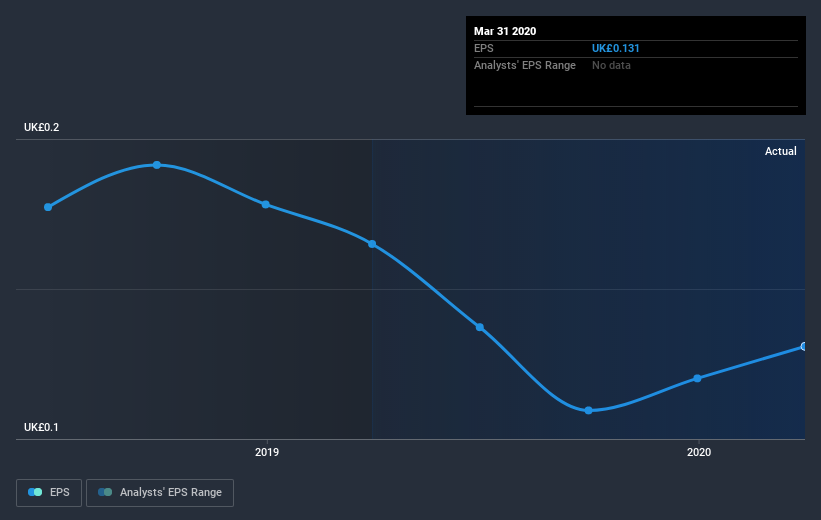
During the three years that the share price fell, Nexus Infrastructure's earnings per share (EPS) dropped by 9.9% each year. So do you think it's a coincidence that the share price has dropped 10% per year, a very similar rate to the EPS? We don't. So it seems that investor expectations of the company are staying pretty steady, despite the disappointment. In this case, it seems that the EPS is guiding the share price.
The company's earnings per share (over time) is depicted in the image below (click to see the exact numbers).

We like that insiders have been buying shares in the last twelve months. Having said that, most people consider earnings and revenue growth trends to be a more meaningful guide to the business. Before buying or selling a stock, we always recommend a close examination of historic growth trends, available here..
What about the Total Shareholder Return (TSR)?
We'd be remiss not to mention the difference between Nexus Infrastructure's total shareholder return (TSR) and its share price return. The TSR attempts to capture the value of dividends (as if they were reinvested) as well as any spin-offs or discounted capital raisings offered to shareholders. Its history of dividend payouts mean that Nexus Infrastructure's TSR, which was a 21% drop over the last 3 years, was not as bad as the share price return.
A Different Perspective
The last twelve months weren't great for Nexus Infrastructure shares, which performed worse than the market, costing holders 8.4%. The market shed around 7.2%, no doubt weighing on the stock price. Shareholders have lost 7% per year over the last three years, so the share price drop has become steeper, over the last year; a potential symptom of as yet unsolved challenges. We would be wary of buying into a company with unsolved problems, although some investors will buy into struggling stocks if they believe the price is sufficiently attractive. While it is well worth considering the different impacts that market conditions can have on the share price, there are other factors that are even more important. Consider for instance, the ever-present spectre of investment risk. We've identified 6 warning signs with Nexus Infrastructure (at least 2 which are potentially serious) , and understanding them should be part of your investment process.
Nexus Infrastructure is not the only stock that insiders are buying. For those who like to find winning investments this free list of growing companies with recent insider purchasing, could be just the ticket.
Please note, the market returns quoted in this article reflect the market weighted average returns of stocks that currently trade on GB exchanges.
If you’re looking to trade Nexus Infrastructure, open an account with the lowest-cost* platform trusted by professionals, Interactive Brokers. Their clients from over 200 countries and territories trade stocks, options, futures, forex, bonds and funds worldwide from a single integrated account. Promoted
Valuation is complex, but we're here to simplify it.
Discover if Nexus Infrastructure might be undervalued or overvalued with our detailed analysis, featuring fair value estimates, potential risks, dividends, insider trades, and its financial condition.
Access Free AnalysisThis article by Simply Wall St is general in nature. It does not constitute a recommendation to buy or sell any stock, and does not take account of your objectives, or your financial situation. We aim to bring you long-term focused analysis driven by fundamental data. Note that our analysis may not factor in the latest price-sensitive company announcements or qualitative material. Simply Wall St has no position in any stocks mentioned.
*Interactive Brokers Rated Lowest Cost Broker by StockBrokers.com Annual Online Review 2020
Have feedback on this article? Concerned about the content? Get in touch with us directly. Alternatively, email editorial-team@simplywallst.com.
About AIM:NEXS
Nexus Infrastructure
Offers infrastructure and civil engineering services to the housebuilding and commercial sectors in the United Kingdom.
Flawless balance sheet low.

