- France
- /
- Transportation
- /
- ENXTPA:STF
STEF (EPA:STF) stock performs better than its underlying earnings growth over last five years


When we invest, we're generally looking for stocks that outperform the market average. And the truth is, you can make significant gains if you buy good quality businesses at the right price. For example, the STEF SA (EPA:STF) share price is up 61% in the last 5 years, clearly besting the market return of around 27% (ignoring dividends). On the other hand, the more recent gains haven't been so impressive, with shareholders gaining just 36%, including dividends.
The past week has proven to be lucrative for STEF investors, so let's see if fundamentals drove the company's five-year performance.
Check out our latest analysis for STEF
While the efficient markets hypothesis continues to be taught by some, it has been proven that markets are over-reactive dynamic systems, and investors are not always rational. One way to examine how market sentiment has changed over time is to look at the interaction between a company's share price and its earnings per share (EPS).
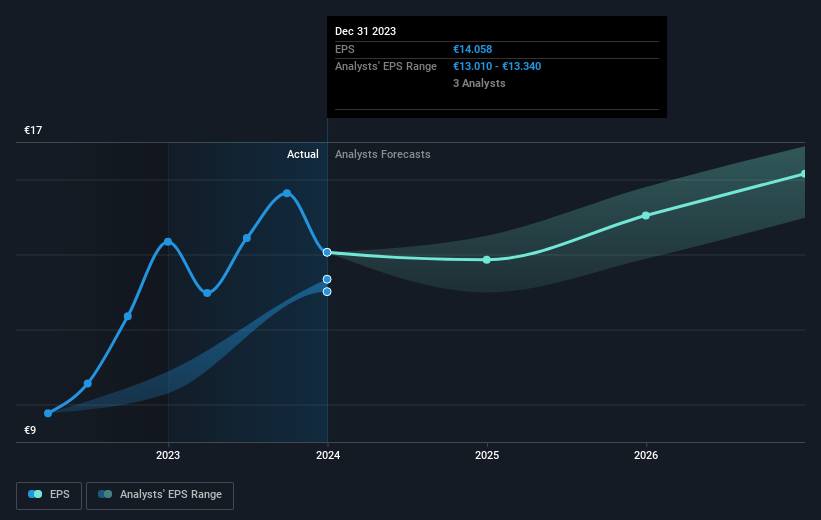
During five years of share price growth, STEF achieved compound earnings per share (EPS) growth of 13% per year. This EPS growth is higher than the 10% average annual increase in the share price. So one could conclude that the broader market has become more cautious towards the stock. This cautious sentiment is reflected in its (fairly low) P/E ratio of 9.85.
You can see below how EPS has changed over time (discover the exact values by clicking on the image).
We know that STEF has improved its bottom line over the last three years, but what does the future have in store? This free interactive report on STEF's balance sheet strength is a great place to start, if you want to investigate the stock further.
What About Dividends?
When looking at investment returns, it is important to consider the difference between total shareholder return (TSR) and share price return. The TSR incorporates the value of any spin-offs or discounted capital raisings, along with any dividends, based on the assumption that the dividends are reinvested. So for companies that pay a generous dividend, the TSR is often a lot higher than the share price return. In the case of STEF, it has a TSR of 88% for the last 5 years. That exceeds its share price return that we previously mentioned. And there's no prize for guessing that the dividend payments largely explain the divergence!
A Different Perspective
It's nice to see that STEF shareholders have received a total shareholder return of 36% over the last year. That's including the dividend. Since the one-year TSR is better than the five-year TSR (the latter coming in at 14% per year), it would seem that the stock's performance has improved in recent times. Given the share price momentum remains strong, it might be worth taking a closer look at the stock, lest you miss an opportunity. It's always interesting to track share price performance over the longer term. But to understand STEF better, we need to consider many other factors. Take risks, for example - STEF has 2 warning signs we think you should be aware of.
We will like STEF better if we see some big insider buys. While we wait, check out this free list of undervalued stocks (mostly small caps) with considerable, recent, insider buying.
Please note, the market returns quoted in this article reflect the market weighted average returns of stocks that currently trade on French exchanges.
New: Manage All Your Stock Portfolios in One Place
We've created the ultimate portfolio companion for stock investors, and it's free.
• Connect an unlimited number of Portfolios and see your total in one currency
• Be alerted to new Warning Signs or Risks via email or mobile
• Track the Fair Value of your stocks
Have feedback on this article? Concerned about the content? Get in touch with us directly. Alternatively, email editorial-team (at) simplywallst.com.
This article by Simply Wall St is general in nature. We provide commentary based on historical data and analyst forecasts only using an unbiased methodology and our articles are not intended to be financial advice. It does not constitute a recommendation to buy or sell any stock, and does not take account of your objectives, or your financial situation. We aim to bring you long-term focused analysis driven by fundamental data. Note that our analysis may not factor in the latest price-sensitive company announcements or qualitative material. Simply Wall St has no position in any stocks mentioned.
About ENXTPA:STF
STEF
Provides temperature-controlled road transport and logistics services for agri-food industry, and out-of-home foodservices.
Undervalued with adequate balance sheet.
