- France
- /
- Communications
- /
- ENXTPA:ALKLK
It's Down 27% But Kerlink SA (EPA:ALKLK) Could Be Riskier Than It Looks
To the annoyance of some shareholders, Kerlink SA (EPA:ALKLK) shares are down a considerable 27% in the last month, which continues a horrid run for the company. For any long-term shareholders, the last month ends a year to forget by locking in a 54% share price decline.
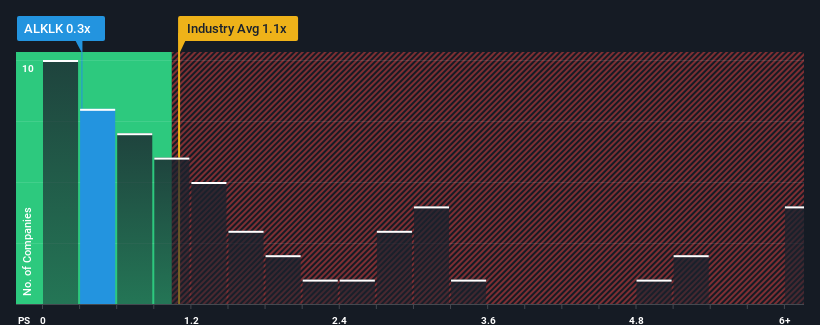
Although its price has dipped substantially, there still wouldn't be many who think Kerlink's price-to-sales (or "P/S") ratio of 0.3x is worth a mention when the median P/S in France's Communications industry is similar at about 0.7x. Although, it's not wise to simply ignore the P/S without explanation as investors may be disregarding a distinct opportunity or a costly mistake.
View our latest analysis for Kerlink

How Has Kerlink Performed Recently?
Kerlink could be doing better as its revenue has been going backwards lately while most other companies have been seeing positive revenue growth. It might be that many expect the dour revenue performance to strengthen positively, which has kept the P/S from falling. You'd really hope so, otherwise you're paying a relatively elevated price for a company with this sort of growth profile.
If you'd like to see what analysts are forecasting going forward, you should check out our free report on Kerlink.What Are Revenue Growth Metrics Telling Us About The P/S?
Kerlink's P/S ratio would be typical for a company that's only expected to deliver moderate growth, and importantly, perform in line with the industry.
Taking a look back first, the company's revenue growth last year wasn't something to get excited about as it posted a disappointing decline of 27%. Regardless, revenue has managed to lift by a handy 23% in aggregate from three years ago, thanks to the earlier period of growth. So we can start by confirming that the company has generally done a good job of growing revenue over that time, even though it had some hiccups along the way.
Turning to the outlook, the next year should generate growth of 25% as estimated by the only analyst watching the company. Meanwhile, the rest of the industry is forecast to only expand by 3.8%, which is noticeably less attractive.
With this information, we find it interesting that Kerlink is trading at a fairly similar P/S compared to the industry. Apparently some shareholders are skeptical of the forecasts and have been accepting lower selling prices.
What Does Kerlink's P/S Mean For Investors?
With its share price dropping off a cliff, the P/S for Kerlink looks to be in line with the rest of the Communications industry. It's argued the price-to-sales ratio is an inferior measure of value within certain industries, but it can be a powerful business sentiment indicator.
Looking at Kerlink's analyst forecasts revealed that its superior revenue outlook isn't giving the boost to its P/S that we would've expected. Perhaps uncertainty in the revenue forecasts are what's keeping the P/S ratio consistent with the rest of the industry. It appears some are indeed anticipating revenue instability, because these conditions should normally provide a boost to the share price.
There are also other vital risk factors to consider before investing and we've discovered 2 warning signs for Kerlink that you should be aware of.
If strong companies turning a profit tickle your fancy, then you'll want to check out this free list of interesting companies that trade on a low P/E (but have proven they can grow earnings).
Valuation is complex, but we're here to simplify it.
Discover if Kerlink might be undervalued or overvalued with our detailed analysis, featuring fair value estimates, potential risks, dividends, insider trades, and its financial condition.
Access Free AnalysisHave feedback on this article? Concerned about the content? Get in touch with us directly. Alternatively, email editorial-team (at) simplywallst.com.
This article by Simply Wall St is general in nature. We provide commentary based on historical data and analyst forecasts only using an unbiased methodology and our articles are not intended to be financial advice. It does not constitute a recommendation to buy or sell any stock, and does not take account of your objectives, or your financial situation. We aim to bring you long-term focused analysis driven by fundamental data. Note that our analysis may not factor in the latest price-sensitive company announcements or qualitative material. Simply Wall St has no position in any stocks mentioned.
Have feedback on this article? Concerned about the content? Get in touch with us directly. Alternatively, email editorial-team@simplywallst.com
About ENXTPA:ALKLK
Kerlink
Provides network infrastructure solutions for the Internet of Things (IoT) market to historical and alternative operators, businesses, and utilities in Europe, the Middle East, Africa, the Asia-Pacific, and the Americas.
High growth potential with adequate balance sheet.
Market Insights
Weekly Picks


Crazy Undervalued 42 Baggers Silver Play (Active & Running Mine)


Fiducian: Compliance Clouds or Value Opportunity?

Willamette Valley Vineyards (WVVI): Not-So-Great Value
Recently Updated Narratives

Watch Pulse Seismic Outperform with 13.6% Revenue Growth in the Coming Years

Significantly undervalued gold explorer in Timmins, finally getting traction

Moderation and Stabilisation: HOLD: Fair Price based on a 4-year Cycle is $12.08
Popular Narratives


MicroVision will explode future revenue by 380.37% with a vision towards success


NVDA: Expanding AI Demand Will Drive Major Data Center Investments Through 2026


