Capgemini SE (EPA:CAP) Shares Could Be 22% Below Their Intrinsic Value Estimate


Key Insights
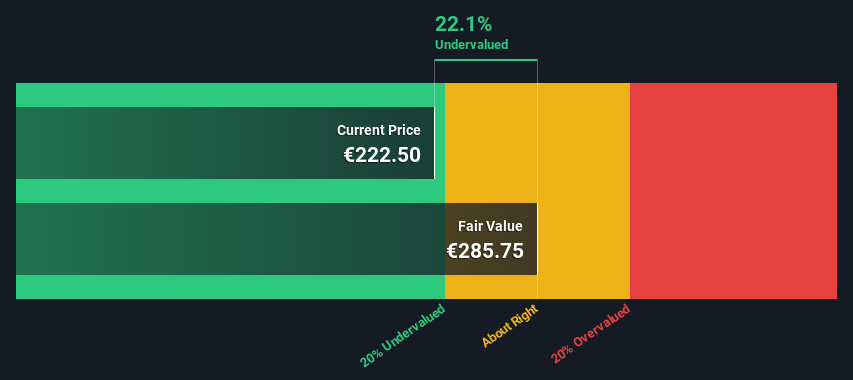
- Capgemini's estimated fair value is €286 based on 2 Stage Free Cash Flow to Equity
- Capgemini's €223 share price signals that it might be 22% undervalued
- Our fair value estimate is 18% higher than Capgemini's analyst price target of €241
Today we'll do a simple run through of a valuation method used to estimate the attractiveness of Capgemini SE (EPA:CAP) as an investment opportunity by taking the expected future cash flows and discounting them to their present value. This will be done using the Discounted Cash Flow (DCF) model. It may sound complicated, but actually it is quite simple!
We would caution that there are many ways of valuing a company and, like the DCF, each technique has advantages and disadvantages in certain scenarios. For those who are keen learners of equity analysis, the Simply Wall St analysis model here may be something of interest to you.
See our latest analysis for Capgemini
Step By Step Through The Calculation
We're using the 2-stage growth model, which simply means we take in account two stages of company's growth. In the initial period the company may have a higher growth rate and the second stage is usually assumed to have a stable growth rate. To start off with, we need to estimate the next ten years of cash flows. Where possible we use analyst estimates, but when these aren't available we extrapolate the previous free cash flow (FCF) from the last estimate or reported value. We assume companies with shrinking free cash flow will slow their rate of shrinkage, and that companies with growing free cash flow will see their growth rate slow, over this period. We do this to reflect that growth tends to slow more in the early years than it does in later years.
Generally we assume that a dollar today is more valuable than a dollar in the future, so we need to discount the sum of these future cash flows to arrive at a present value estimate:
10-year free cash flow (FCF) estimate
| 2024 | 2025 | 2026 | 2027 | 2028 | 2029 | 2030 | 2031 | 2032 | 2033 | |
| Levered FCF (€, Millions) | €1.97b | €2.22b | €2.52b | €2.71b | €3.00b | €3.21b | €3.38b | €3.51b | €3.61b | €3.70b |
| Growth Rate Estimate Source | Analyst x5 | Analyst x5 | Analyst x3 | Analyst x1 | Analyst x1 | Est @ 6.90% | Est @ 5.12% | Est @ 3.87% | Est @ 3.00% | Est @ 2.39% |
| Present Value (€, Millions) Discounted @ 7.3% | €1.8k | €1.9k | €2.0k | €2.0k | €2.1k | €2.1k | €2.1k | €2.0k | €1.9k | €1.8k |
("Est" = FCF growth rate estimated by Simply Wall St)
Present Value of 10-year Cash Flow (PVCF) = €20b
The second stage is also known as Terminal Value, this is the business's cash flow after the first stage. For a number of reasons a very conservative growth rate is used that cannot exceed that of a country's GDP growth. In this case we have used the 5-year average of the 10-year government bond yield (1.0%) to estimate future growth. In the same way as with the 10-year 'growth' period, we discount future cash flows to today's value, using a cost of equity of 7.3%.
Terminal Value (TV)= FCF2033 × (1 + g) ÷ (r – g) = €3.7b× (1 + 1.0%) ÷ (7.3%– 1.0%) = €59b
Present Value of Terminal Value (PVTV)= TV / (1 + r)10= €59b÷ ( 1 + 7.3%)10= €29b
The total value is the sum of cash flows for the next ten years plus the discounted terminal value, which results in the Total Equity Value, which in this case is €49b. The last step is to then divide the equity value by the number of shares outstanding. Compared to the current share price of €223, the company appears a touch undervalued at a 22% discount to where the stock price trades currently. Remember though, that this is just an approximate valuation, and like any complex formula - garbage in, garbage out.
The Assumptions
The calculation above is very dependent on two assumptions. The first is the discount rate and the other is the cash flows. If you don't agree with these result, have a go at the calculation yourself and play with the assumptions. The DCF also does not consider the possible cyclicality of an industry, or a company's future capital requirements, so it does not give a full picture of a company's potential performance. Given that we are looking at Capgemini as potential shareholders, the cost of equity is used as the discount rate, rather than the cost of capital (or weighted average cost of capital, WACC) which accounts for debt. In this calculation we've used 7.3%, which is based on a levered beta of 1.195. Beta is a measure of a stock's volatility, compared to the market as a whole. We get our beta from the industry average beta of globally comparable companies, with an imposed limit between 0.8 and 2.0, which is a reasonable range for a stable business.
SWOT Analysis for Capgemini
- Earnings growth over the past year exceeded the industry.
- Debt is well covered by earnings and cashflows.
- Dividends are covered by earnings and cash flows.
- Earnings growth over the past year is below its 5-year average.
- Dividend is low compared to the top 25% of dividend payers in the IT market.
- Annual revenue is forecast to grow faster than the French market.
- Good value based on P/E ratio and estimated fair value.
- Annual earnings are forecast to grow slower than the French market.
Looking Ahead:
Valuation is only one side of the coin in terms of building your investment thesis, and it is only one of many factors that you need to assess for a company. DCF models are not the be-all and end-all of investment valuation. Rather it should be seen as a guide to "what assumptions need to be true for this stock to be under/overvalued?" If a company grows at a different rate, or if its cost of equity or risk free rate changes sharply, the output can look very different. Why is the intrinsic value higher than the current share price? For Capgemini, we've compiled three important aspects you should look at:
- Risks: To that end, you should be aware of the 1 warning sign we've spotted with Capgemini .
- Future Earnings: How does CAP's growth rate compare to its peers and the wider market? Dig deeper into the analyst consensus number for the upcoming years by interacting with our free analyst growth expectation chart.
- Other Solid Businesses: Low debt, high returns on equity and good past performance are fundamental to a strong business. Why not explore our interactive list of stocks with solid business fundamentals to see if there are other companies you may not have considered!
PS. Simply Wall St updates its DCF calculation for every French stock every day, so if you want to find the intrinsic value of any other stock just search here.
New: AI Stock Screener & Alerts
Our new AI Stock Screener scans the market every day to uncover opportunities.
• Dividend Powerhouses (3%+ Yield)
• Undervalued Small Caps with Insider Buying
• High growth Tech and AI Companies
Or build your own from over 50 metrics.
Have feedback on this article? Concerned about the content? Get in touch with us directly. Alternatively, email editorial-team (at) simplywallst.com.
This article by Simply Wall St is general in nature. We provide commentary based on historical data and analyst forecasts only using an unbiased methodology and our articles are not intended to be financial advice. It does not constitute a recommendation to buy or sell any stock, and does not take account of your objectives, or your financial situation. We aim to bring you long-term focused analysis driven by fundamental data. Note that our analysis may not factor in the latest price-sensitive company announcements or qualitative material. Simply Wall St has no position in any stocks mentioned.
About ENXTPA:CAP
Capgemini
Engages in the provision of consulting, digital transformation, technology, and engineering services primarily in North America, France, the United Kingdom, Ireland, the rest of Europe, the Asia-Pacific, and Latin America.
Undervalued with excellent balance sheet.
Similar Companies
Market Insights

Community Narratives
