- France
- /
- General Merchandise and Department Stores
- /
- ENXTPA:CNV
We Like These Underlying Return On Capital Trends At Cnova (EPA:CNV)


To find a multi-bagger stock, what are the underlying trends we should look for in a business? Firstly, we'd want to identify a growing return on capital employed (ROCE) and then alongside that, an ever-increasing base of capital employed. If you see this, it typically means it's a company with a great business model and plenty of profitable reinvestment opportunities. So on that note, Cnova (EPA:CNV) looks quite promising in regards to its trends of return on capital.
Understanding Return On Capital Employed (ROCE)
Just to clarify if you're unsure, ROCE is a metric for evaluating how much pre-tax income (in percentage terms) a company earns on the capital invested in its business. The formula for this calculation on Cnova is:
Return on Capital Employed = Earnings Before Interest and Tax (EBIT) ÷ (Total Assets - Current Liabilities)
0.16 = €50m ÷ (€1.2b - €901m) (Based on the trailing twelve months to June 2021).
So, Cnova has an ROCE of 16%. In absolute terms, that's a pretty normal return, and it's somewhat close to the Online Retail industry average of 18%.
View our latest analysis for Cnova
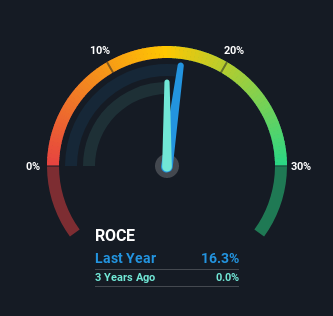
Historical performance is a great place to start when researching a stock so above you can see the gauge for Cnova's ROCE against it's prior returns. If you're interested in investigating Cnova's past further, check out this free graph of past earnings, revenue and cash flow.
The Trend Of ROCE
The trends we've noticed at Cnova are quite reassuring. Over the last five years, returns on capital employed have risen substantially to 16%. The amount of capital employed has increased too, by 651%. The increasing returns on a growing amount of capital is common amongst multi-baggers and that's why we're impressed.
In another part of our analysis, we noticed that the company's ratio of current liabilities to total assets decreased to 75%, which broadly means the business is relying less on its suppliers or short-term creditors to fund its operations. Therefore we can rest assured that the growth in ROCE is a result of the business' fundamental improvements, rather than a cooking class featuring this company's books. Nevertheless, there are some potential risks the company is bearing with current liabilities that high, so just keep that in mind.
What We Can Learn From Cnova's ROCE
To sum it up, Cnova has proven it can reinvest in the business and generate higher returns on that capital employed, which is terrific. Since the stock has returned a solid 51% to shareholders over the last five years, it's fair to say investors are beginning to recognize these changes. Therefore, we think it would be worth your time to check if these trends are going to continue.
If you want to know some of the risks facing Cnova we've found 2 warning signs (1 is significant!) that you should be aware of before investing here.
While Cnova isn't earning the highest return, check out this free list of companies that are earning high returns on equity with solid balance sheets.
If you're looking to trade Cnova, open an account with the lowest-cost platform trusted by professionals, Interactive Brokers.
With clients in over 200 countries and territories, and access to 160 markets, IBKR lets you trade stocks, options, futures, forex, bonds and funds from a single integrated account.
Enjoy no hidden fees, no account minimums, and FX conversion rates as low as 0.03%, far better than what most brokers offer.
Sponsored ContentNew: AI Stock Screener & Alerts
Our new AI Stock Screener scans the market every day to uncover opportunities.
• Dividend Powerhouses (3%+ Yield)
• Undervalued Small Caps with Insider Buying
• High growth Tech and AI Companies
Or build your own from over 50 metrics.
This article by Simply Wall St is general in nature. We provide commentary based on historical data and analyst forecasts only using an unbiased methodology and our articles are not intended to be financial advice. It does not constitute a recommendation to buy or sell any stock, and does not take account of your objectives, or your financial situation. We aim to bring you long-term focused analysis driven by fundamental data. Note that our analysis may not factor in the latest price-sensitive company announcements or qualitative material. Simply Wall St has no position in any stocks mentioned.
Have feedback on this article? Concerned about the content? Get in touch with us directly. Alternatively, email editorial-team (at) simplywallst.com.
About ENXTPA:CNV
Moderate and slightly overvalued.

