Advertisement
- Norway
- /
- Oil and Gas
- /
- OB:ALNG
European Penny Stocks To Watch: 3 Picks Under €50M Market Cap

Simply Wall St
Reviewed by Simply Wall St
As European markets navigate a complex landscape of interest rate policies and trade uncertainties, investors are keenly observing opportunities that may arise. Though the term 'penny stock' might sound like a relic of past trading days, the opportunity it points to is still relevant. Typically referring to smaller or relatively new companies, these stocks can provide a mix of affordability and growth potential when paired with strong financials.
Top 10 Penny Stocks In Europe
| Name | Share Price | Market Cap | Rewards & Risks |
| Ariston Holding (BIT:ARIS) | €4.09 | €1.42B | ✅ 5 ⚠️ 2 View Analysis > |
| Maps (BIT:MAPS) | €3.21 | €42.64M | ✅ 5 ⚠️ 1 View Analysis > |
| Angler Gaming (NGM:ANGL) | SEK3.60 | SEK269.95M | ✅ 4 ⚠️ 2 View Analysis > |
| Angler Gaming (DB:0QM) | €0.37 | €225.7M | ✅ 2 ⚠️ 2 View Analysis > |
| Siili Solutions Oyj (HLSE:SIILI) | €4.88 | €39.57M | ✅ 3 ⚠️ 3 View Analysis > |
| IAMBA Arad (BVB:FERO) | RON0.484 | RON16.37M | ✅ 2 ⚠️ 4 View Analysis > |
| Euroland Société anonyme (ENXTPA:ALERO) | €3.18 | €10.09M | ✅ 2 ⚠️ 5 View Analysis > |
| ForFarmers (ENXTAM:FFARM) | €4.405 | €389.34M | ✅ 4 ⚠️ 1 View Analysis > |
| Deceuninck (ENXTBR:DECB) | €2.025 | €279.9M | ✅ 4 ⚠️ 1 View Analysis > |
| Netgem (ENXTPA:ALNTG) | €0.894 | €29.94M | ✅ 2 ⚠️ 2 View Analysis > |
Click here to see the full list of 334 stocks from our European Penny Stocks screener.
Let's uncover some gems from our specialized screener.
FIPP (ENXTPA:FIPP)
Simply Wall St Financial Health Rating: ★★★★☆☆
Overview: FIPP S.A. operates in the real estate sector both in Paris and internationally, with a market cap of €14.88 million.
Operations: The company generates revenue from three main segments: €0.06 million from shops, €1.69 million from hotels, and €0.50 million from housing.
Market Cap: €14.88M
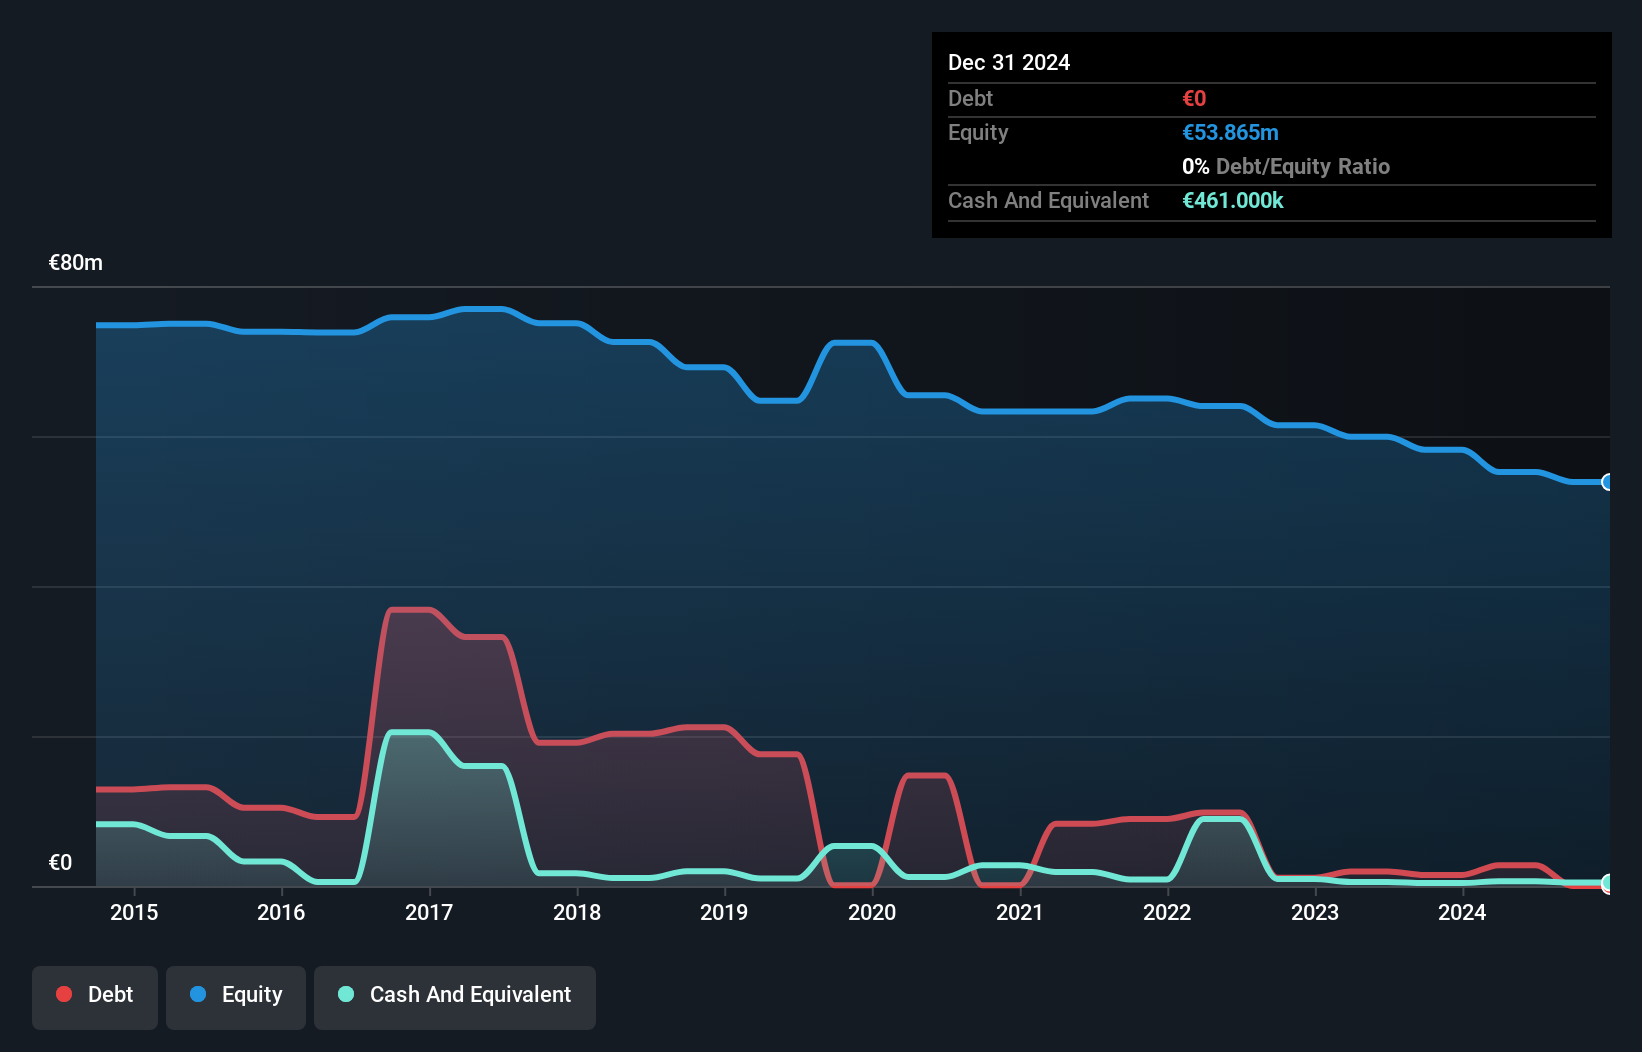
FIPP S.A., with a market cap of €14.88 million, operates in the real estate sector and generates revenue from shops (€0.06 million), hotels (€1.69 million), and housing (€0.50 million). Despite being debt-free, FIPP is currently unprofitable with its short-term assets (€2.7M) unable to cover both short-term (€22.2M) and long-term liabilities (€4.1M). The company trades at 62.9% below its estimated fair value, yet faces high share price volatility and negative return on equity (-8.54%). While losses have increased over the past five years by 7% annually, it maintains a cash runway exceeding three years due to positive free cash flow growth.
- Jump into the full analysis health report here for a deeper understanding of FIPP.
- Learn about FIPP's historical performance here.
Betolar Oyj (HLSE:BETOLAR)
Simply Wall St Financial Health Rating: ★★★★★☆
Overview: Betolar Oyj is a materials technology company that offers solutions for utilizing industrial sidestreams to create low-carbon and cement-free products for the mining, metals, and construction sectors across Europe, the Middle East, Africa, the Asia Pacific, and the Americas with a market cap of €27.82 million.
Operations: The company's revenue primarily comes from its construction materials segment, generating €0.90 million.
Market Cap: €27.82M
Betolar Oyj, with a market cap of €27.82 million, is pre-revenue and focuses on innovative materials technology for sustainable construction solutions. Recent strategic alliances highlight its commitment to expanding its low-carbon technologies in mining and construction sectors globally. Collaborations with Nordkalk and Jetcrete aim to commercialize eco-friendly products like circular calcite and low-carbon shotcrete. Despite an unprofitable status and increasing debt-to-equity ratio, Betolar maintains a sufficient cash runway for over a year. Its board is experienced, though management tenure suggests relative inexperience. The company’s volatility remains high but stable compared to Finnish peers.
- Click to explore a detailed breakdown of our findings in Betolar Oyj's financial health report.
- Learn about Betolar Oyj's future growth trajectory here.
Awilco LNG (OB:ALNG)
Simply Wall St Financial Health Rating: ★★★★★☆
Overview: Awilco LNG ASA, based in Norway, owns and operates liquefied natural gas (LNG) vessels and has a market cap of NOK542.79 million.
Operations: The company generates revenue of $41.90 million from its LNG transportation segment.
Market Cap: NOK542.79M
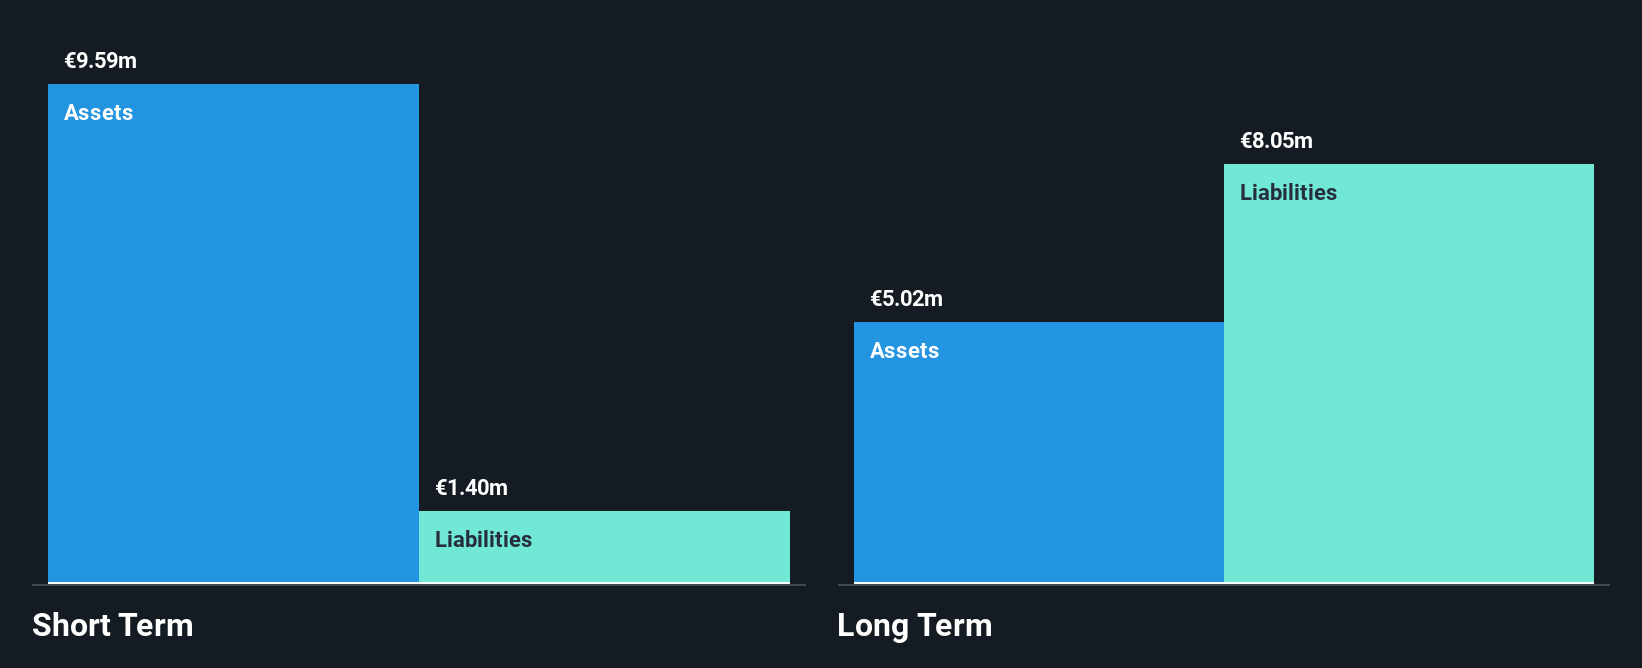
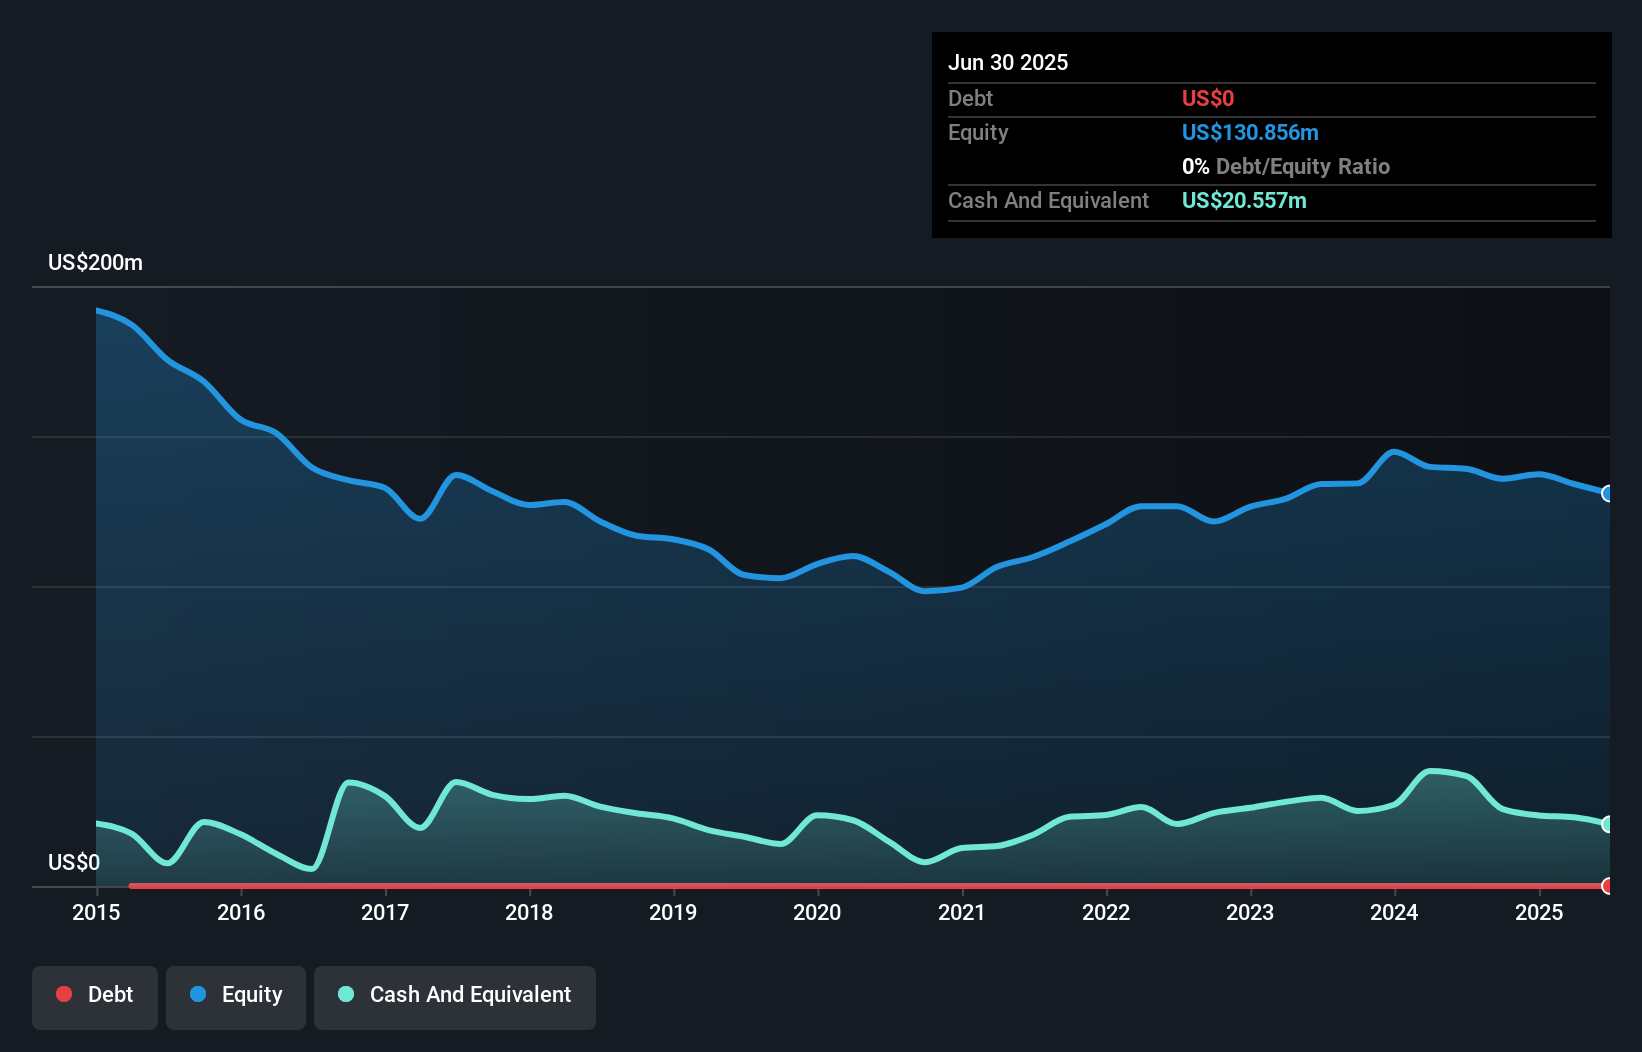
Awilco LNG ASA, with a market cap of NOK542.79 million, operates in the LNG transportation sector, generating US$41.90 million in revenue. Despite being unprofitable and facing a net loss of US$3.14 million for Q2 2025, the company maintains a positive cash flow and has no debt, ensuring over three years of cash runway if current conditions persist. Its short-term assets exceed short-term liabilities but fall short against long-term obligations. The management team is seasoned with an average tenure of 9.2 years; however, share price volatility remains high compared to Norwegian stocks.
- Get an in-depth perspective on Awilco LNG's performance by reading our balance sheet health report here.
- Evaluate Awilco LNG's prospects by accessing our earnings growth report.
Next Steps
- Dive into all 334 of the European Penny Stocks we have identified here.
- Ready For A Different Approach? Uncover 12 companies that survived and thrived after COVID and have the right ingredients to survive Trump's tariffs.
This article by Simply Wall St is general in nature. We provide commentary based on historical data and analyst forecasts only using an unbiased methodology and our articles are not intended to be financial advice. It does not constitute a recommendation to buy or sell any stock, and does not take account of your objectives, or your financial situation. We aim to bring you long-term focused analysis driven by fundamental data. Note that our analysis may not factor in the latest price-sensitive company announcements or qualitative material. Simply Wall St has no position in any stocks mentioned.
New: Manage All Your Stock Portfolios in One Place
We've created the ultimate portfolio companion for stock investors, and it's free.
• Connect an unlimited number of Portfolios and see your total in one currency
• Be alerted to new Warning Signs or Risks via email or mobile
• Track the Fair Value of your stocks
Have feedback on this article? Concerned about the content? Get in touch with us directly. Alternatively, email editorial-team@simplywallst.com
About OB:ALNG
Awilco LNG
Owns and operates liquefied natural gas (LNG) vessels in Norway.
Undervalued with excellent balance sheet.
Similar Companies
Market Insights

Advertisement
Community Narratives
A formidable player in AI and enterprise computing.
Fair Value US$210.00|12.2% overvalued
CO
Community Contributor
IREN's Bold Moves in Sustainable Bitcoin Mining & AI Data Centers
Fair Value US$72.52|17.1% undervalued
BL
Community Contributor
Cooling the Champions: The Aussie Tech Behind F1's Victories
Fair Value AU$12.40|38.7% undervalued
TR
Community Contributor