
Advertisement
METabolic EXplorer S.A. (EPA:METEX) Surges 28% Yet Its Low P/S Is No Reason For Excitement
Those holding METabolic EXplorer S.A. (EPA:METEX) shares would be relieved that the share price has rebounded 28% in the last thirty days, but it needs to keep going to repair the recent damage it has caused to investor portfolios. But the last month did very little to improve the 58% share price decline over the last year.
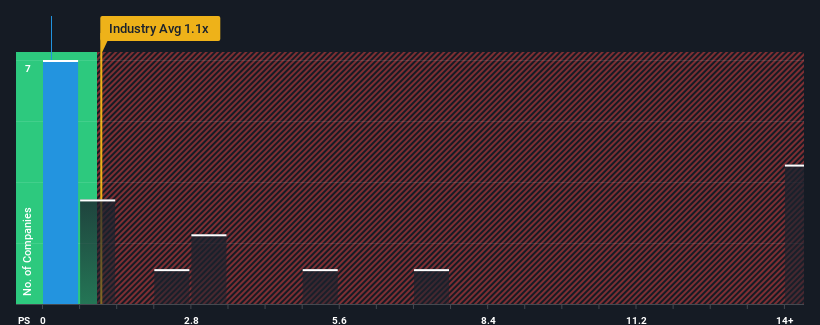
Although its price has surged higher, METabolic EXplorer may still be sending bullish signals at the moment with its price-to-sales (or "P/S") ratio of 0.2x, since almost half of all companies in the Chemicals industry in France have P/S ratios greater than 1x and even P/S higher than 7x are not unusual. Nonetheless, we'd need to dig a little deeper to determine if there is a rational basis for the reduced P/S.
View our latest analysis for METabolic EXplorer
What Does METabolic EXplorer's P/S Mean For Shareholders?
METabolic EXplorer could be doing better as its revenue has been going backwards lately while most other companies have been seeing positive revenue growth. The P/S ratio is probably low because investors think this poor revenue performance isn't going to get any better. So while you could say the stock is cheap, investors will be looking for improvement before they see it as good value.
Want the full picture on analyst estimates for the company? Then our free report on METabolic EXplorer will help you uncover what's on the horizon.How Is METabolic EXplorer's Revenue Growth Trending?
The only time you'd be truly comfortable seeing a P/S as low as METabolic EXplorer's is when the company's growth is on track to lag the industry.
Retrospectively, the last year delivered a frustrating 36% decrease to the company's top line. The latest three year period has seen an incredible overall rise in revenue, a stark contrast to the last 12 months. So while the company has done a great job in the past, it's somewhat concerning to see revenue growth decline so harshly.
Shifting to the future, estimates from the only analyst covering the company suggest revenue should grow by 7.6% over the next year. Meanwhile, the rest of the industry is forecast to expand by 35%, which is noticeably more attractive.
With this information, we can see why METabolic EXplorer is trading at a P/S lower than the industry. Apparently many shareholders weren't comfortable holding on while the company is potentially eyeing a less prosperous future.
The Key Takeaway
METabolic EXplorer's stock price has surged recently, but its but its P/S still remains modest. We'd say the price-to-sales ratio's power isn't primarily as a valuation instrument but rather to gauge current investor sentiment and future expectations.
We've established that METabolic EXplorer maintains its low P/S on the weakness of its forecast growth being lower than the wider industry, as expected. Shareholders' pessimism on the revenue prospects for the company seems to be the main contributor to the depressed P/S. Unless these conditions improve, they will continue to form a barrier for the share price around these levels.
You should always think about risks. Case in point, we've spotted 5 warning signs for METabolic EXplorer you should be aware of, and 1 of them makes us a bit uncomfortable.
Of course, profitable companies with a history of great earnings growth are generally safer bets. So you may wish to see this free collection of other companies that have reasonable P/E ratios and have grown earnings strongly.
New: Manage All Your Stock Portfolios in One Place
We've created the ultimate portfolio companion for stock investors, and it's free.
• Connect an unlimited number of Portfolios and see your total in one currency
• Be alerted to new Warning Signs or Risks via email or mobile
• Track the Fair Value of your stocks
Have feedback on this article? Concerned about the content? Get in touch with us directly. Alternatively, email editorial-team (at) simplywallst.com.
This article by Simply Wall St is general in nature. We provide commentary based on historical data and analyst forecasts only using an unbiased methodology and our articles are not intended to be financial advice. It does not constitute a recommendation to buy or sell any stock, and does not take account of your objectives, or your financial situation. We aim to bring you long-term focused analysis driven by fundamental data. Note that our analysis may not factor in the latest price-sensitive company announcements or qualitative material. Simply Wall St has no position in any stocks mentioned.
About ENXTPA:METEX
METabolic EXplorer
A biological chemistry company, engages in the development and industrialization of industrial fermentation processes as alternatives to petrochemical processes worldwide.
Low and slightly overvalued.
Similar Companies
Market Insights

Advertisement
Community Narratives
A formidable player in AI and enterprise computing.
Fair Value US$210.00|12.2% overvalued
CO
Community Contributor
IREN's Bold Moves in Sustainable Bitcoin Mining & AI Data Centers
Fair Value US$72.52|17.1% undervalued
BL
Community Contributor
Cooling the Champions: The Aussie Tech Behind F1's Victories
Fair Value AU$12.40|38.7% undervalued
TR
Community Contributor