
Advertisement
- France
- /
- Medical Equipment
- /
- ENXTPA:ALPIX
Reflecting on Pixium Vision's (EPA:ALPIX) Share Price Returns Over The Last Five Years

Pixium Vision SA (EPA:ALPIX) shareholders will doubtless be very grateful to see the share price up 92% in the last quarter. But spare a thought for the long term holders, who have held the stock as it bled value over the last five years. Like a ship taking on water, the share price has sunk 80% in that time. So we don't gain too much confidence from the recent recovery. The real question is whether the business can leave its past behind and improve itself over the years ahead.
We really feel for shareholders in this scenario. It's a good reminder of the importance of diversification, and it's worth keeping in mind there's more to life than money, anyway.
View our latest analysis for Pixium Vision
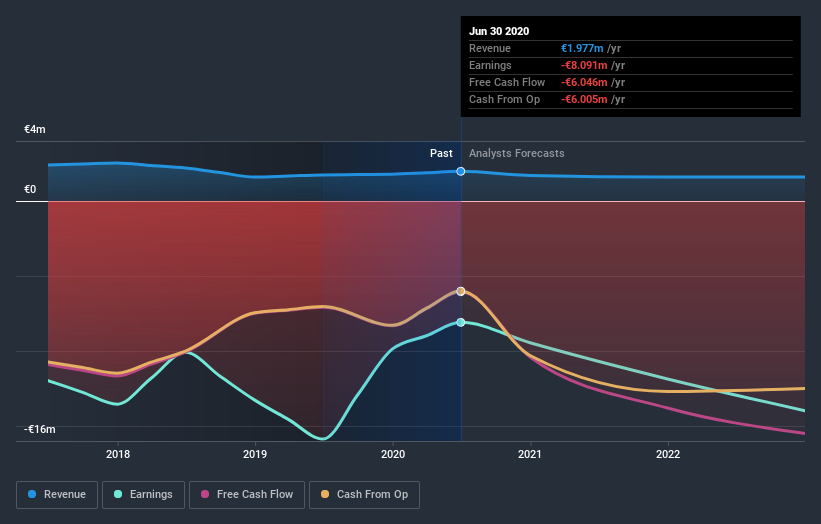
Pixium Vision isn't currently profitable, so most analysts would look to revenue growth to get an idea of how fast the underlying business is growing. When a company doesn't make profits, we'd generally expect to see good revenue growth. That's because fast revenue growth can be easily extrapolated to forecast profits, often of considerable size.
Over half a decade Pixium Vision reduced its trailing twelve month revenue by 14% for each year. That puts it in an unattractive cohort, to put it mildly. So it's not altogether surprising to see the share price down 13% per year in the same time period. This kind of price performance makes us very wary, especially when combined with falling revenue. Of course, the poor performance could mean the market has been too severe selling down. That can happen.
You can see below how earnings and revenue have changed over time (discover the exact values by clicking on the image).
Balance sheet strength is crucial. It might be well worthwhile taking a look at our free report on how its financial position has changed over time.
What about the Total Shareholder Return (TSR)?
We've already covered Pixium Vision's share price action, but we should also mention its total shareholder return (TSR). The TSR is a return calculation that accounts for the value of cash dividends (assuming that any dividend received was reinvested) and the calculated value of any discounted capital raisings and spin-offs. We note that Pixium Vision's TSR, at -76% is higher than its share price return of -80%. When you consider it hasn't been paying a dividend, this data suggests shareholders have benefitted from a spin-off, or had the opportunity to acquire attractively priced shares in a discounted capital raising.
A Different Perspective
It's nice to see that Pixium Vision shareholders have received a total shareholder return of 49% over the last year. Notably the five-year annualised TSR loss of 12% per year compares very unfavourably with the recent share price performance. The long term loss makes us cautious, but the short term TSR gain certainly hints at a brighter future. It's always interesting to track share price performance over the longer term. But to understand Pixium Vision better, we need to consider many other factors. For instance, we've identified 6 warning signs for Pixium Vision (2 don't sit too well with us) that you should be aware of.
If you would prefer to check out another company -- one with potentially superior financials -- then do not miss this free list of companies that have proven they can grow earnings.
Please note, the market returns quoted in this article reflect the market weighted average returns of stocks that currently trade on FR exchanges.
If you’re looking to trade Pixium Vision, open an account with the lowest-cost* platform trusted by professionals, Interactive Brokers. Their clients from over 200 countries and territories trade stocks, options, futures, forex, bonds and funds worldwide from a single integrated account. Promoted
New: Manage All Your Stock Portfolios in One Place
We've created the ultimate portfolio companion for stock investors, and it's free.
• Connect an unlimited number of Portfolios and see your total in one currency
• Be alerted to new Warning Signs or Risks via email or mobile
• Track the Fair Value of your stocks
This article by Simply Wall St is general in nature. It does not constitute a recommendation to buy or sell any stock, and does not take account of your objectives, or your financial situation. We aim to bring you long-term focused analysis driven by fundamental data. Note that our analysis may not factor in the latest price-sensitive company announcements or qualitative material. Simply Wall St has no position in any stocks mentioned.
*Interactive Brokers Rated Lowest Cost Broker by StockBrokers.com Annual Online Review 2020
Have feedback on this article? Concerned about the content? Get in touch with us directly. Alternatively, email editorial-team (at) simplywallst.com.
About ENXTPA:ALPIX
Pixium Vision
Pixium Vision SA, a bioelectronics and brain machine interface technology company, specialized in neuromodulation application.
Slightly overvalued with weak fundamentals.
Market Insights

Advertisement
Community Narratives
Scaling up in building materials with smart M&A and growing profitability
Fair Value US$2.77|24.5% undervalued
CM
Community Contributor
Hims: The Platform Powering Personalised Healthcare
Fair Value US$114.01|45.3% undervalued
BL
Community Contributor
Undervalued lottery company with strong fundamentals
Fair Value AU$15.00|33.9% undervalued
RO
Community Contributor
Proximus, transferring money from the impatient to the patient investor
Fair Value €16.62|57.0% undervalued
AX
Community Contributor