
Advertisement
Is L.D.C. S.A.'s (EPA:LOUP) Latest Stock Performance Being Led By Its Strong Fundamentals?
L.D.C's (EPA:LOUP) stock is up by 2.9% over the past three months. Since the market usually pay for a company’s long-term financial health, we decided to study the company’s fundamentals to see if they could be influencing the market. In this article, we decided to focus on L.D.C's ROE.
Return on equity or ROE is a key measure used to assess how efficiently a company's management is utilizing the company's capital. In short, ROE shows the profit each dollar generates with respect to its shareholder investments.
Check out our latest analysis for L.D.C
How Is ROE Calculated?
The formula for return on equity is:
Return on Equity = Net Profit (from continuing operations) ÷ Shareholders' Equity
So, based on the above formula, the ROE for L.D.C is:
14% = €308m ÷ €2.1b (Based on the trailing twelve months to February 2024).
The 'return' refers to a company's earnings over the last year. One way to conceptualize this is that for each €1 of shareholders' capital it has, the company made €0.14 in profit.
What Is The Relationship Between ROE And Earnings Growth?
So far, we've learned that ROE is a measure of a company's profitability. Depending on how much of these profits the company reinvests or "retains", and how effectively it does so, we are then able to assess a company’s earnings growth potential. Generally speaking, other things being equal, firms with a high return on equity and profit retention, have a higher growth rate than firms that don’t share these attributes.
L.D.C's Earnings Growth And 14% ROE
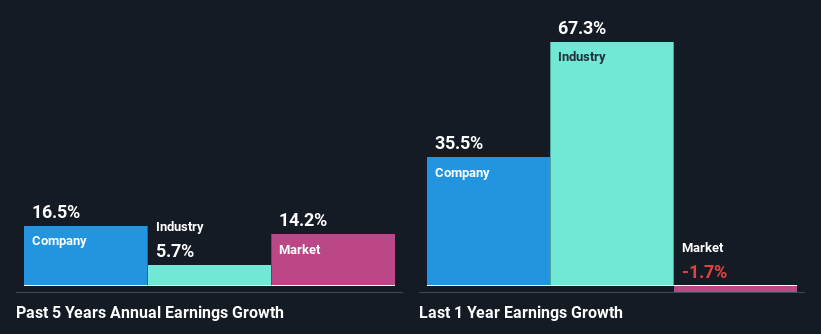
At first glance, L.D.C seems to have a decent ROE. On comparing with the average industry ROE of 7.9% the company's ROE looks pretty remarkable. This certainly adds some context to L.D.C's decent 16% net income growth seen over the past five years.
As a next step, we compared L.D.C's net income growth with the industry, and pleasingly, we found that the growth seen by the company is higher than the average industry growth of 5.7%.
Earnings growth is a huge factor in stock valuation. The investor should try to establish if the expected growth or decline in earnings, whichever the case may be, is priced in. This then helps them determine if the stock is placed for a bright or bleak future. One good indicator of expected earnings growth is the P/E ratio which determines the price the market is willing to pay for a stock based on its earnings prospects. So, you may want to check if L.D.C is trading on a high P/E or a low P/E, relative to its industry.
Is L.D.C Making Efficient Use Of Its Profits?
L.D.C has a low three-year median payout ratio of 20%, meaning that the company retains the remaining 80% of its profits. This suggests that the management is reinvesting most of the profits to grow the business.
Additionally, L.D.C has paid dividends over a period of at least ten years which means that the company is pretty serious about sharing its profits with shareholders. Our latest analyst data shows that the future payout ratio of the company over the next three years is expected to be approximately 20%. Regardless, L.D.C's ROE is speculated to decline to 11% despite there being no anticipated change in its payout ratio.
Conclusion
On the whole, we feel that L.D.C's performance has been quite good. Specifically, we like that the company is reinvesting a huge chunk of its profits at a high rate of return. This of course has caused the company to see substantial growth in its earnings. With that said, the latest industry analyst forecasts reveal that the company's earnings growth is expected to slow down. To know more about the company's future earnings growth forecasts take a look at this free report on analyst forecasts for the company to find out more.
New: AI Stock Screener & Alerts
Our new AI Stock Screener scans the market every day to uncover opportunities.
• Dividend Powerhouses (3%+ Yield)
• Undervalued Small Caps with Insider Buying
• High growth Tech and AI Companies
Or build your own from over 50 metrics.
Have feedback on this article? Concerned about the content? Get in touch with us directly. Alternatively, email editorial-team (at) simplywallst.com.
This article by Simply Wall St is general in nature. We provide commentary based on historical data and analyst forecasts only using an unbiased methodology and our articles are not intended to be financial advice. It does not constitute a recommendation to buy or sell any stock, and does not take account of your objectives, or your financial situation. We aim to bring you long-term focused analysis driven by fundamental data. Note that our analysis may not factor in the latest price-sensitive company announcements or qualitative material. Simply Wall St has no position in any stocks mentioned.
About ENXTPA:LOUP
L.D.C
Produces and sells poultry and processed products in France and internationally.
Flawless balance sheet and undervalued.
Market Insights

Advertisement
Community Narratives
Kodiak AI - a potential 100 bagger opportunity?
Fair Value US$14.00|44.7% undervalued
DA
Community Contributor
A Fair Price for a Great Business Facing Real Threats
Fair Value US$383.06|13.0% undervalued
IM
Community Contributor
AXON And Shopify Integration Will Unlock Global Mobile Advertising
Fair Value US$646.30|0% overvalued
AN
Based on Analyst Price Targets