Sapmer SA (EPA:ALMER) Stock's 34% Dive Might Signal An Opportunity But It Requires Some Scrutiny


Sapmer SA (EPA:ALMER) shareholders that were waiting for something to happen have been dealt a blow with a 34% share price drop in the last month. Instead of being rewarded, shareholders who have already held through the last twelve months are now sitting on a 48% share price drop.
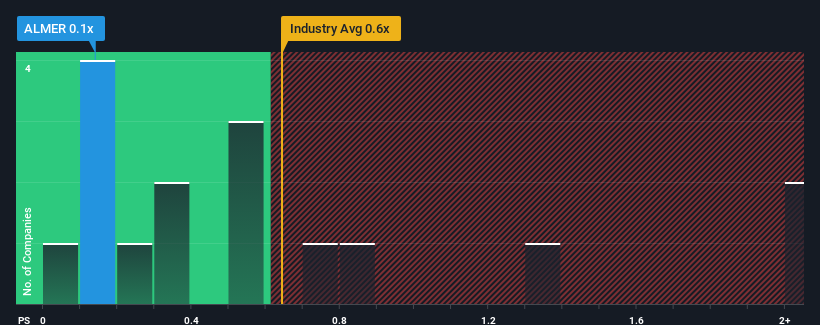
Even after such a large drop in price, you could still be forgiven for feeling indifferent about Sapmer's P/S ratio of 0.1x, since the median price-to-sales (or "P/S") ratio for the Food industry in France is also close to 0.4x. However, investors might be overlooking a clear opportunity or potential setback if there is no rational basis for the P/S.
Check out our latest analysis for Sapmer
What Does Sapmer's Recent Performance Look Like?
Sapmer has been doing a decent job lately as it's been growing revenue at a reasonable pace. Perhaps the expectation moving forward is that the revenue growth will track in line with the wider industry for the near term, which has kept the P/S subdued. Those who are bullish on Sapmer will be hoping that this isn't the case, so that they can pick up the stock at a lower valuation.
Want the full picture on earnings, revenue and cash flow for the company? Then our free report on Sapmer will help you shine a light on its historical performance.What Are Revenue Growth Metrics Telling Us About The P/S?
Sapmer's P/S ratio would be typical for a company that's only expected to deliver moderate growth, and importantly, perform in line with the industry.
Taking a look back first, we see that the company managed to grow revenues by a handy 2.7% last year. Revenue has also lifted 26% in aggregate from three years ago, partly thanks to the last 12 months of growth. So we can start by confirming that the company has actually done a good job of growing revenue over that time.
Comparing that to the industry, which is predicted to shrink 2.2% in the next 12 months, the company's positive momentum based on recent medium-term revenue results is a bright spot for the moment.
In light of this, it's peculiar that Sapmer's P/S sits in line with the majority of other companies. Apparently some shareholders believe the recent performance is at its limits and have been accepting lower selling prices.
What Does Sapmer's P/S Mean For Investors?
Following Sapmer's share price tumble, its P/S is just clinging on to the industry median P/S. Generally, our preference is to limit the use of the price-to-sales ratio to establishing what the market thinks about the overall health of a company.
As mentioned previously, Sapmer currently trades on a P/S on par with the wider industry, but this is lower than expected considering its recent three-year revenue growth is beating forecasts for a struggling industry. When we see a history of positive growth in a struggling industry, but only an average P/S, we assume potential risks are what might be placing pressure on the P/S ratio. One major risk is whether its revenue trajectory can keep outperforming under these tough industry conditions. The fact that the company's relative performance has not provided a kick to the share price suggests that some investors are anticipating revenue instability.
And what about other risks? Every company has them, and we've spotted 4 warning signs for Sapmer (of which 2 are potentially serious!) you should know about.
It's important to make sure you look for a great company, not just the first idea you come across. So if growing profitability aligns with your idea of a great company, take a peek at this free list of interesting companies with strong recent earnings growth (and a low P/E).
If you're looking to trade Sapmer, open an account with the lowest-cost platform trusted by professionals, Interactive Brokers.
With clients in over 200 countries and territories, and access to 160 markets, IBKR lets you trade stocks, options, futures, forex, bonds and funds from a single integrated account.
Enjoy no hidden fees, no account minimums, and FX conversion rates as low as 0.03%, far better than what most brokers offer.
Sponsored ContentNew: Manage All Your Stock Portfolios in One Place
We've created the ultimate portfolio companion for stock investors, and it's free.
• Connect an unlimited number of Portfolios and see your total in one currency
• Be alerted to new Warning Signs or Risks via email or mobile
• Track the Fair Value of your stocks
Have feedback on this article? Concerned about the content? Get in touch with us directly. Alternatively, email editorial-team (at) simplywallst.com.
This article by Simply Wall St is general in nature. We provide commentary based on historical data and analyst forecasts only using an unbiased methodology and our articles are not intended to be financial advice. It does not constitute a recommendation to buy or sell any stock, and does not take account of your objectives, or your financial situation. We aim to bring you long-term focused analysis driven by fundamental data. Note that our analysis may not factor in the latest price-sensitive company announcements or qualitative material. Simply Wall St has no position in any stocks mentioned.
About ENXTPA:ALMER
Sapmer
Operates as a fishing company in South Africa, Northern America, Mauritius, Japan, Europe, China, and Réunion Island.
Very low and overvalued.
Market Insights

Community Narratives


