
Advertisement

David Iben put it well when he said, 'Volatility is not a risk we care about. What we care about is avoiding the permanent loss of capital.' It's only natural to consider a company's balance sheet when you examine how risky it is, since debt is often involved when a business collapses. We can see that Technip Energies N.V. (EPA:TE) does use debt in its business. But the real question is whether this debt is making the company risky.
What Risk Does Debt Bring?
Debt assists a business until the business has trouble paying it off, either with new capital or with free cash flow. If things get really bad, the lenders can take control of the business. While that is not too common, we often do see indebted companies permanently diluting shareholders because lenders force them to raise capital at a distressed price. Of course, debt can be an important tool in businesses, particularly capital heavy businesses. The first step when considering a company's debt levels is to consider its cash and debt together.
View our latest analysis for Technip Energies
What Is Technip Energies's Debt?
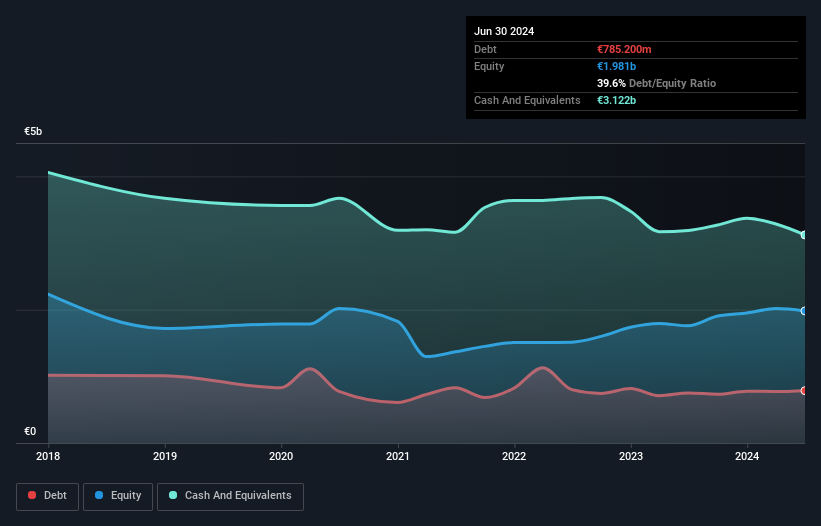
As you can see below, at the end of June 2024, Technip Energies had €785.2m of debt, up from €751.2m a year ago. Click the image for more detail. However, its balance sheet shows it holds €3.12b in cash, so it actually has €2.34b net cash.
How Strong Is Technip Energies' Balance Sheet?
We can see from the most recent balance sheet that Technip Energies had liabilities of €5.53b falling due within a year, and liabilities of €1.16b due beyond that. On the other hand, it had cash of €3.12b and €2.03b worth of receivables due within a year. So it has liabilities totalling €1.54b more than its cash and near-term receivables, combined.
Technip Energies has a market capitalization of €3.94b, so it could very likely raise cash to ameliorate its balance sheet, if the need arose. But it's clear that we should definitely closely examine whether it can manage its debt without dilution. Despite its noteworthy liabilities, Technip Energies boasts net cash, so it's fair to say it does not have a heavy debt load!
Technip Energies's EBIT was pretty flat over the last year, but that shouldn't be an issue given the it doesn't have a lot of debt. There's no doubt that we learn most about debt from the balance sheet. But ultimately the future profitability of the business will decide if Technip Energies can strengthen its balance sheet over time. So if you're focused on the future you can check out this free report showing analyst profit forecasts.
Finally, while the tax-man may adore accounting profits, lenders only accept cold hard cash. While Technip Energies has net cash on its balance sheet, it's still worth taking a look at its ability to convert earnings before interest and tax (EBIT) to free cash flow, to help us understand how quickly it is building (or eroding) that cash balance. Over the most recent three years, Technip Energies recorded free cash flow worth 63% of its EBIT, which is around normal, given free cash flow excludes interest and tax. This cold hard cash means it can reduce its debt when it wants to.
Summing Up
Although Technip Energies's balance sheet isn't particularly strong, due to the total liabilities, it is clearly positive to see that it has net cash of €2.34b. So we are not troubled with Technip Energies's debt use. There's no doubt that we learn most about debt from the balance sheet. But ultimately, every company can contain risks that exist outside of the balance sheet. To that end, you should be aware of the 1 warning sign we've spotted with Technip Energies .
At the end of the day, it's often better to focus on companies that are free from net debt. You can access our special list of such companies (all with a track record of profit growth). It's free.
Valuation is complex, but we're here to simplify it.
Discover if Technip Energies might be undervalued or overvalued with our detailed analysis, featuring fair value estimates, potential risks, dividends, insider trades, and its financial condition.
Access Free AnalysisHave feedback on this article? Concerned about the content? Get in touch with us directly. Alternatively, email editorial-team (at) simplywallst.com.
This article by Simply Wall St is general in nature. We provide commentary based on historical data and analyst forecasts only using an unbiased methodology and our articles are not intended to be financial advice. It does not constitute a recommendation to buy or sell any stock, and does not take account of your objectives, or your financial situation. We aim to bring you long-term focused analysis driven by fundamental data. Note that our analysis may not factor in the latest price-sensitive company announcements or qualitative material. Simply Wall St has no position in any stocks mentioned.
About ENXTPA:TE
Technip Energies
Operates as an engineering and technology company for the energy transition in Europe, Central Asia, the Asia Pacific, Africa, the Middle East, and the Americas.
Flawless balance sheet with solid track record.
Similar Companies
Market Insights

Advertisement
Community Narratives
Scaling up in building materials with smart M&A and growing profitability
Fair Value US$2.77|30.0% undervalued
CM
Community Contributor
Hims: The Platform Powering Personalised Healthcare
Fair Value US$114.01|51.9% undervalued
BL
Community Contributor
Undervalued lottery company with strong fundamentals
Fair Value AU$15.00|34.5% undervalued
RO
Community Contributor
Proximus, transferring money from the impatient to the patient investor
Fair Value €16.62|55.1% undervalued
AX
Community Contributor