- France
- /
- Capital Markets
- /
- ENXTPA:ENX
Investing in Euronext (EPA:ENX) a year ago would have delivered you a 57% gain


If you want to compound wealth in the stock market, you can do so by buying an index fund. But investors can boost returns by picking market-beating companies to own shares in. To wit, the Euronext N.V. (EPA:ENX) share price is 53% higher than it was a year ago, much better than the market return of around 3.0% (not including dividends) in the same period. So that should have shareholders smiling. However, the longer term returns haven't been so impressive, with the stock up just 1.2% in the last three years.
Now it's worth having a look at the company's fundamentals too, because that will help us determine if the long term shareholder return has matched the performance of the underlying business.
Check out our latest analysis for Euronext
To quote Buffett, 'Ships will sail around the world but the Flat Earth Society will flourish. There will continue to be wide discrepancies between price and value in the marketplace...' By comparing earnings per share (EPS) and share price changes over time, we can get a feel for how investor attitudes to a company have morphed over time.
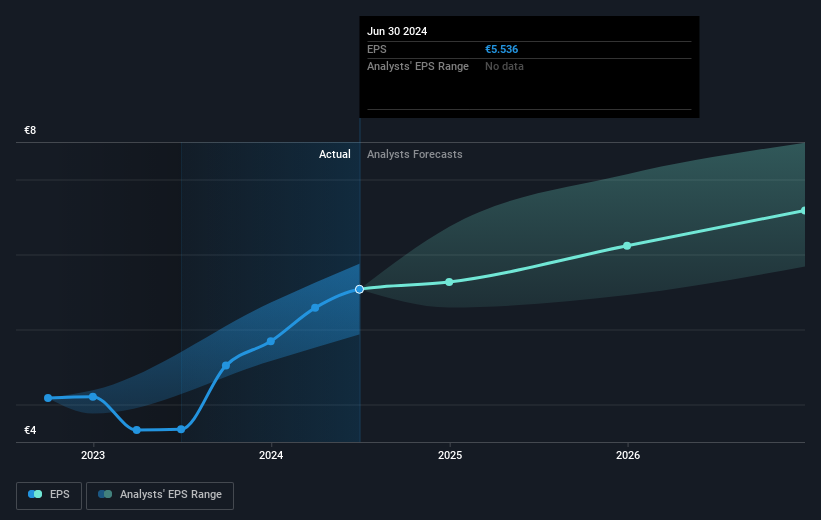
Euronext was able to grow EPS by 51% in the last twelve months. The similarity between the EPS growth and the 53% share price gain really stands out. That suggests that the market sentiment around the company hasn't changed much over that time. It looks like the share price is responding to the EPS.
You can see below how EPS has changed over time (discover the exact values by clicking on the image).
We know that Euronext has improved its bottom line lately, but is it going to grow revenue? Check if analysts think Euronext will grow revenue in the future.
What About Dividends?
When looking at investment returns, it is important to consider the difference between total shareholder return (TSR) and share price return. The TSR is a return calculation that accounts for the value of cash dividends (assuming that any dividend received was reinvested) and the calculated value of any discounted capital raisings and spin-offs. It's fair to say that the TSR gives a more complete picture for stocks that pay a dividend. We note that for Euronext the TSR over the last 1 year was 57%, which is better than the share price return mentioned above. This is largely a result of its dividend payments!
A Different Perspective
We're pleased to report that Euronext shareholders have received a total shareholder return of 57% over one year. That's including the dividend. Since the one-year TSR is better than the five-year TSR (the latter coming in at 10% per year), it would seem that the stock's performance has improved in recent times. Someone with an optimistic perspective could view the recent improvement in TSR as indicating that the business itself is getting better with time. It's always interesting to track share price performance over the longer term. But to understand Euronext better, we need to consider many other factors. For instance, we've identified 1 warning sign for Euronext that you should be aware of.
If you are like me, then you will not want to miss this free list of undervalued small caps that insiders are buying.
Please note, the market returns quoted in this article reflect the market weighted average returns of stocks that currently trade on French exchanges.
Valuation is complex, but we're here to simplify it.
Discover if Euronext might be undervalued or overvalued with our detailed analysis, featuring fair value estimates, potential risks, dividends, insider trades, and its financial condition.
Access Free AnalysisHave feedback on this article? Concerned about the content? Get in touch with us directly. Alternatively, email editorial-team (at) simplywallst.com.
This article by Simply Wall St is general in nature. We provide commentary based on historical data and analyst forecasts only using an unbiased methodology and our articles are not intended to be financial advice. It does not constitute a recommendation to buy or sell any stock, and does not take account of your objectives, or your financial situation. We aim to bring you long-term focused analysis driven by fundamental data. Note that our analysis may not factor in the latest price-sensitive company announcements or qualitative material. Simply Wall St has no position in any stocks mentioned.
About ENXTPA:ENX
Euronext
Operates securities and derivatives exchanges in Continental Europe, Ireland, and Norway.
Flawless balance sheet established dividend payer.

