Advertisement
Is Kering’s 25.9% Rally Justified After Recent Growth in Luxury Demand?

Simply Wall St
Reviewed by Bailey Pemberton
If you’re looking at Kering stock and feeling a little torn, you’re not alone. In just the past month the share price has surged 25.9%, and over the last year, it’s up an impressive 36.2%. After a tough few years during which Kering lost ground, dropping 27.7% over three years and a significant 41.0% over five, the recent bounce has certainly grabbed the market’s attention. It’s enough to make any investor wonder if the story has changed for good, or if this is just a short-term rally in a longer phase of uncertainty.
Much of this latest upswing appears tied to broader positive sentiment in the luxury sector, as investors grow more optimistic about demand cycles and macro conditions in key international markets. While there haven’t been major news shocks recently, speculation about future brand repositioning and shifting consumer preferences have contributed to a sharp re-rating of risk and reward. The year-to-date climb of 28.8% suggests traders are looking for growth potential, not just stability.
But before you jump in, it’s worth pausing to look more closely at valuation. By traditional measures, Kering’s value score sits at 0, since it is not undervalued in any of the six checks we track. That might signal some caution, or perhaps that other factors are driving the stock right now. In the next section, we’ll dig into the specific valuation approaches and what they reveal, before exploring an even better lens for understanding how Kering is truly valued.
Kering scores just 0/6 on our valuation checks. See what other red flags we found in the full valuation breakdown.
Approach 1: Kering Discounted Cash Flow (DCF) Analysis
The Discounted Cash Flow (DCF) model estimates a company’s intrinsic value by projecting its future free cash flows and discounting them back to today’s value. This approach provides a present-day snapshot of what the business is fundamentally worth.
For Kering, the latest reported Free Cash Flow stands at €1.70 billion. Analysts project that cash flows will continue to increase, with estimates reaching €2.20 billion by 2029. While direct analyst forecasts typically extend about five years out, longer-term projections are extrapolated to provide a clearer picture of future performance.
The DCF calculation for Kering, based on the 2 Stage Free Cash Flow to Equity model, results in an intrinsic value of €254.92 per share. Comparing this with the current market price, the implied discount is negative 19.2%, suggesting that the stock is trading about 19% above its calculated fair value.
This finding means Kering shares appear to be overvalued according to the DCF model, given cash flow expectations and required return rates.
Result: OVERVALUED
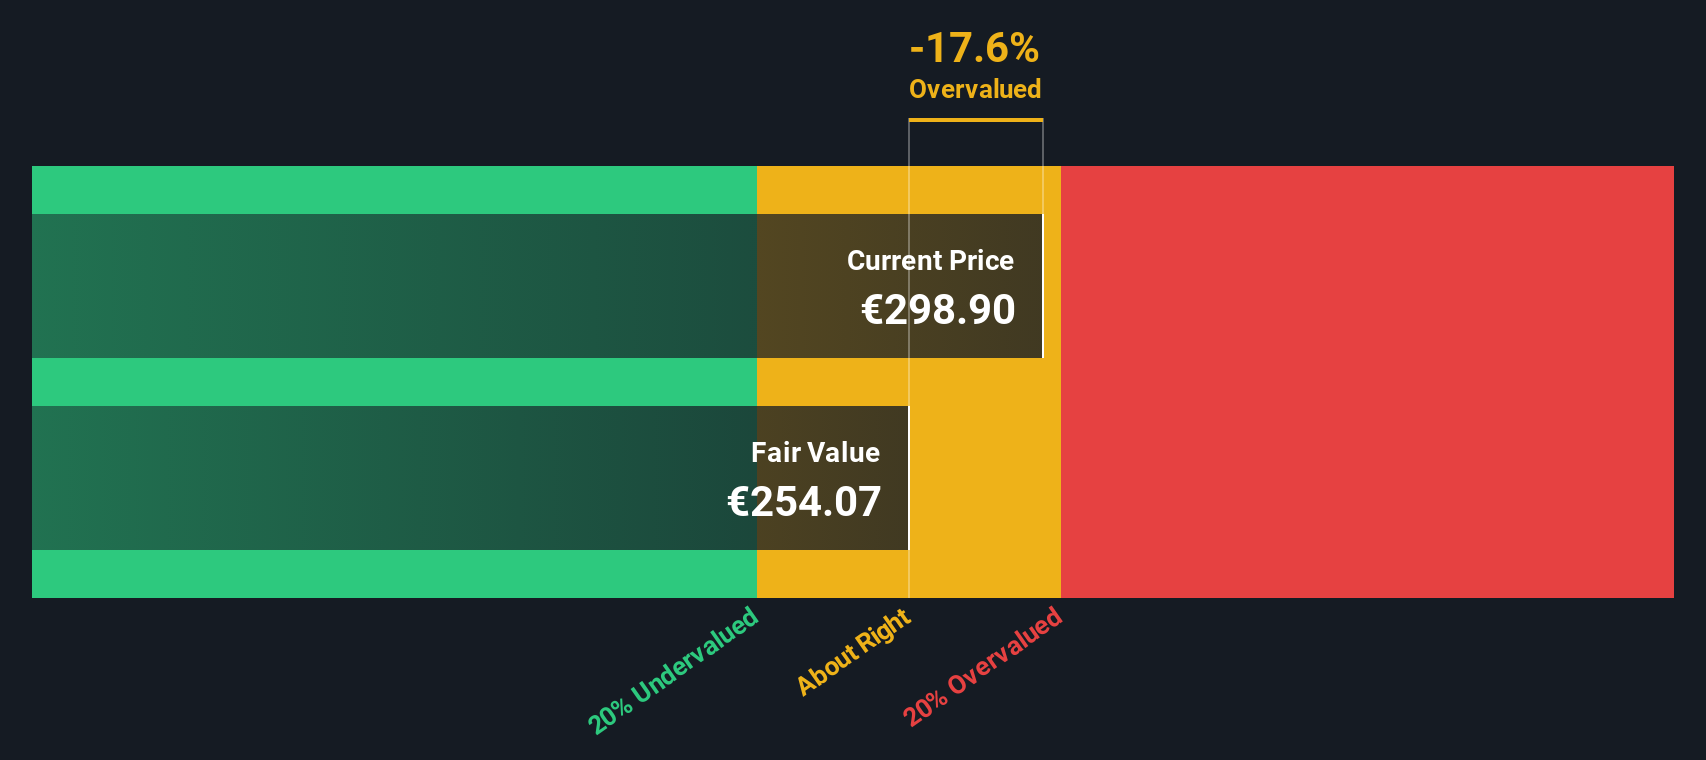
Our Discounted Cash Flow (DCF) analysis suggests Kering may be overvalued by 19.2%. Find undervalued stocks or create your own screener to find better value opportunities.
Approach 2: Kering Price vs Earnings (PE Ratio Analysis)
The Price-to-Earnings (PE) ratio is often the go-to valuation metric for profitable companies like Kering because it links a company’s market value directly to its earnings. Investors rely on the PE ratio to understand how much they are paying for each euro of current earnings, allowing for straightforward comparisons across companies and industries.
However, what counts as a “fair” PE ratio is shaped by more than just immediate profit. Factors such as expected earnings growth, future risks, industry profitability, and even market climate all play a part. Generally, companies with faster growth and lower perceived risks justify higher PE ratios, while those with slower growth or greater uncertainty should trade at lower multiples.
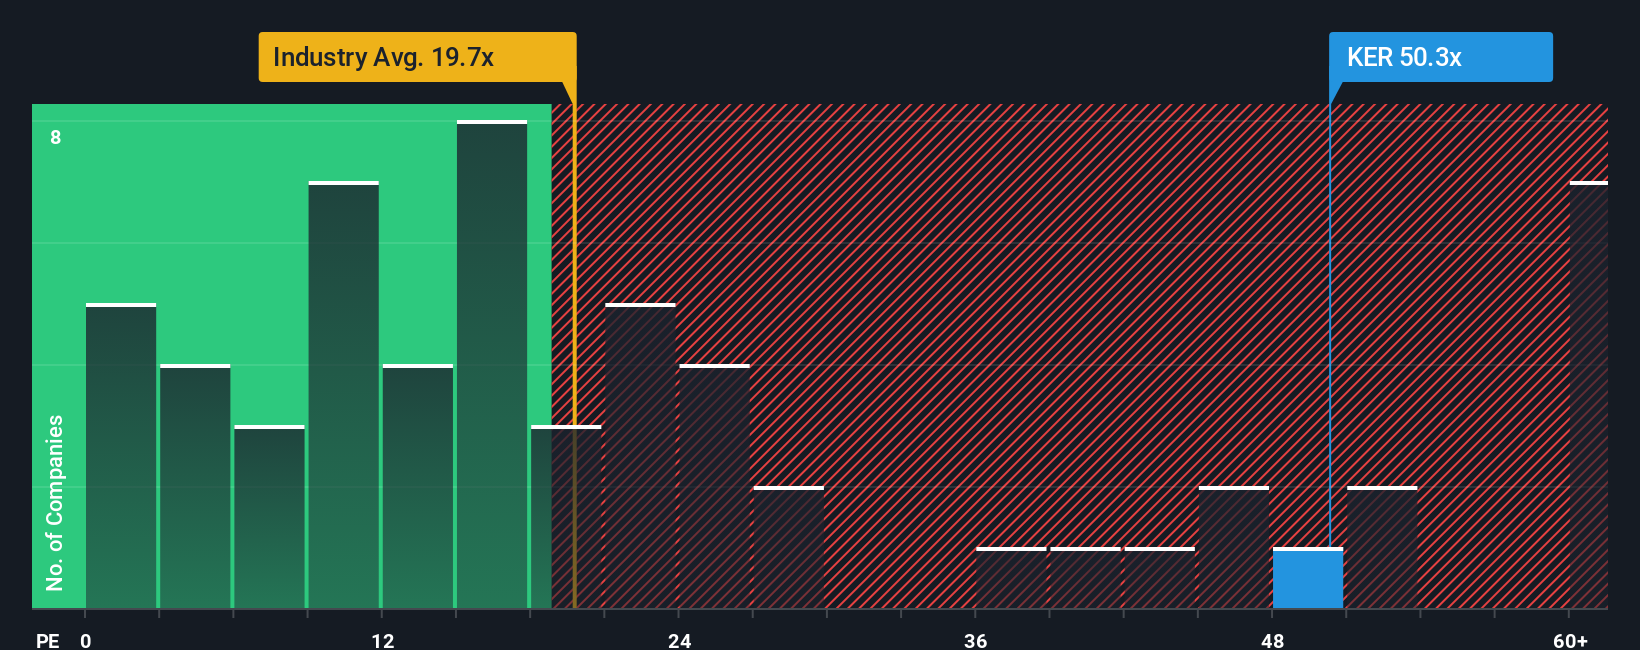
Kering is currently trading at a PE multiple of 51.08x. This is well above both the luxury industry’s average of 18.49x and the peer average of 30.16x, which signals that investors have high expectations for Kering’s future. However, these straight comparisons do not tell the full story. Simply Wall St’s “Fair Ratio” is a proprietary metric that calculates what Kering’s PE ratio should be based on its earnings growth, profitability, industry, risk levels, and market cap. This results in a Fair Ratio of 34.94x.
The Fair Ratio offers a more tailored benchmark than blanket industry or peer averages, reflecting the unique blend of Kering’s prospects and challenges. By looking at the difference between Kering’s actual PE (51.08x) and its Fair Ratio (34.94x), it is clear that the stock is trading at a premium beyond what its fundamentals justify.
Result: OVERVALUED
PE ratios tell one story, but what if the real opportunity lies elsewhere? Discover companies where insiders are betting big on explosive growth.
Upgrade Your Decision Making: Choose your Kering Narrative
Earlier we mentioned that there is an even better way to understand valuation, so let’s introduce you to Narratives. A Narrative is simply your story or perspective on a company, combining your expectations for Kering’s future revenue, earnings, and margins with a financial forecast that generates your own fair value.
Rather than just relying on static ratios or market averages, Narratives connect what you believe about a business with the numbers behind it, and then directly into a fair valuation. On Simply Wall St’s Community page, millions of investors easily create and share their own Narratives for Kering, making it a practical and accessible tool for all experience levels.
Narratives empower you to decide when Kering is under- or over-valued by comparing your calculated Fair Value to today’s share price. The best part is that Narratives update automatically whenever fresh news or earnings reports are released, so your view stays current and responsive to what actually matters.
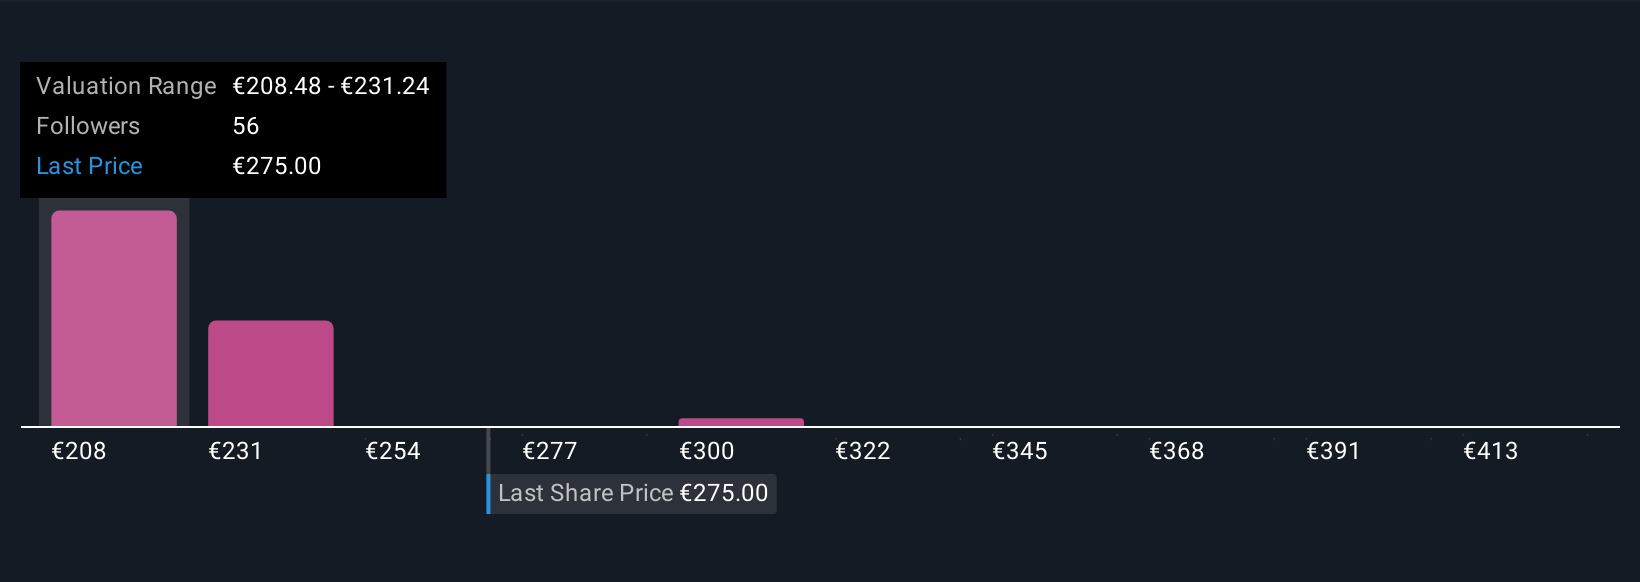
For example, some investors believe that Kering’s digital expansion, store optimization, and sustainability focus will drive strong earnings growth and justify a price as high as €360.0, while others worry about luxury demand and margin risks, leading them to estimate just €135.0. Narratives let you anchor your investment decisions to the story and outlook you truly believe in.
Do you think there's more to the story for Kering? Create your own Narrative to let the Community know!
This article by Simply Wall St is general in nature. We provide commentary based on historical data and analyst forecasts only using an unbiased methodology and our articles are not intended to be financial advice. It does not constitute a recommendation to buy or sell any stock, and does not take account of your objectives, or your financial situation. We aim to bring you long-term focused analysis driven by fundamental data. Note that our analysis may not factor in the latest price-sensitive company announcements or qualitative material. Simply Wall St has no position in any stocks mentioned.
Valuation is complex, but we're here to simplify it.
Discover if Kering might be undervalued or overvalued with our detailed analysis, featuring fair value estimates, potential risks, dividends, insider trades, and its financial condition.
Access Free AnalysisHave feedback on this article? Concerned about the content? Get in touch with us directly. Alternatively, email editorial-team@simplywallst.com
About ENXTPA:KER
Kering
Manages the development of a collection of renowned houses in fashion, leather goods, and jewelry in the Asia Pacific, Western Europe, North America, Japan, and internationally.
Moderate growth potential with mediocre balance sheet.
Market Insights

Advertisement
Community Narratives
A formidable player in AI and enterprise computing.
Fair Value US$210.00|3.1% overvalued
CO
Community Contributor
IREN's Bold Moves in Sustainable Bitcoin Mining & AI Data Centers
Fair Value US$72.52|11.6% undervalued
BL
Community Contributor
Cooling the Champions: The Aussie Tech Behind F1's Victories
Fair Value AU$12.40|40.4% undervalued
TR
Community Contributor