- France
- /
- Professional Services
- /
- ENXTPA:AAA
Market Cool On Alan Allman Associates' (EPA:AAA) Revenues Pushing Shares 26% Lower


Unfortunately for some shareholders, the Alan Allman Associates (EPA:AAA) share price has dived 26% in the last thirty days, prolonging recent pain. The drop over the last 30 days has capped off a tough year for shareholders, with the share price down 46% in that time.
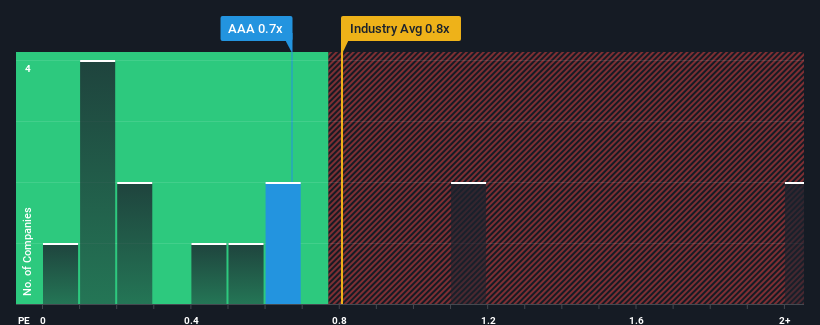
Although its price has dipped substantially, you could still be forgiven for feeling indifferent about Alan Allman Associates' P/S ratio of 0.7x, since the median price-to-sales (or "P/S") ratio for the Professional Services industry in France is also close to 0.5x. While this might not raise any eyebrows, if the P/S ratio is not justified investors could be missing out on a potential opportunity or ignoring looming disappointment.
Check out our latest analysis for Alan Allman Associates
What Does Alan Allman Associates' Recent Performance Look Like?
Recent times have been advantageous for Alan Allman Associates as its revenues have been rising faster than most other companies. It might be that many expect the strong revenue performance to wane, which has kept the P/S ratio from rising. If the company manages to stay the course, then investors should be rewarded with a share price that matches its revenue figures.
Keen to find out how analysts think Alan Allman Associates' future stacks up against the industry? In that case, our free report is a great place to start.What Are Revenue Growth Metrics Telling Us About The P/S?
Alan Allman Associates' P/S ratio would be typical for a company that's only expected to deliver moderate growth, and importantly, perform in line with the industry.
Retrospectively, the last year delivered a decent 8.3% gain to the company's revenues. The latest three year period has also seen an excellent 147% overall rise in revenue, aided somewhat by its short-term performance. Accordingly, shareholders would have definitely welcomed those medium-term rates of revenue growth.
Looking ahead now, revenue is anticipated to climb by 12% during the coming year according to the two analysts following the company. Meanwhile, the rest of the industry is forecast to only expand by 8.5%, which is noticeably less attractive.
In light of this, it's curious that Alan Allman Associates' P/S sits in line with the majority of other companies. It may be that most investors aren't convinced the company can achieve future growth expectations.
What Does Alan Allman Associates' P/S Mean For Investors?
Alan Allman Associates' plummeting stock price has brought its P/S back to a similar region as the rest of the industry. Using the price-to-sales ratio alone to determine if you should sell your stock isn't sensible, however it can be a practical guide to the company's future prospects.
Despite enticing revenue growth figures that outpace the industry, Alan Allman Associates' P/S isn't quite what we'd expect. When we see a strong revenue outlook, with growth outpacing the industry, we can only assume potential uncertainty around these figures are what might be placing slight pressure on the P/S ratio. However, if you agree with the analysts' forecasts, you may be able to pick up the stock at an attractive price.
Having said that, be aware Alan Allman Associates is showing 4 warning signs in our investment analysis, and 2 of those can't be ignored.
It's important to make sure you look for a great company, not just the first idea you come across. So if growing profitability aligns with your idea of a great company, take a peek at this free list of interesting companies with strong recent earnings growth (and a low P/E).
New: Manage All Your Stock Portfolios in One Place
We've created the ultimate portfolio companion for stock investors, and it's free.
• Connect an unlimited number of Portfolios and see your total in one currency
• Be alerted to new Warning Signs or Risks via email or mobile
• Track the Fair Value of your stocks
Have feedback on this article? Concerned about the content? Get in touch with us directly. Alternatively, email editorial-team (at) simplywallst.com.
This article by Simply Wall St is general in nature. We provide commentary based on historical data and analyst forecasts only using an unbiased methodology and our articles are not intended to be financial advice. It does not constitute a recommendation to buy or sell any stock, and does not take account of your objectives, or your financial situation. We aim to bring you long-term focused analysis driven by fundamental data. Note that our analysis may not factor in the latest price-sensitive company announcements or qualitative material. Simply Wall St has no position in any stocks mentioned.
About ENXTPA:AAA
Alan Allman Associates
Engages in the provision of consulting services in Canada, France, Belgium, Luxembourg, Switzerland, and Singapore.
Reasonable growth potential low.
