Advertisement
Should You Reconsider Tarkett After Its 86% Rally and EIB Sustainability Loan News?

Simply Wall St
Reviewed by Simply Wall St
If you are sitting on the fence about what to do with Tarkett stock right now, you are not alone. After all, this flooring specialist has pulled off an impressive rebound, with its share price up a whopping 86.2% over the past year and a massive 56.5% already booked since January. Even though there has been a slight cooling off in the past month, with the stock down 0.3%, those long-term gains are catching just about everyone’s attention.
Much of this momentum comes as investors have re-evaluated the company’s market position against a backdrop of changing industry demand and evolving global supply chains. The muted change over the last week and month suggests the market might be taking a breather. However, do not let that lull you into thinking the story is over. There is still strong underlying interest, especially as investors weigh both growth potential and new risks tied to recent market developments.
Now, if you are wondering whether Tarkett is still a bargain, here is a quick spoiler: by conventional valuation checks, the company is undervalued in 4 out of 6 ways, giving it a value score of 4. That is the kind of figure that gets both value hunters and growth chasers paying attention.
So, how does Tarkett’s valuation actually stack up across the most important metrics? Let us break down the usual approaches analysts use and later explore why there may be an even more insightful way to get to the heart of what Tarkett’s shares are really worth.
Tarkett delivered 86.2% returns over the last year. See how this stacks up to the rest of the Building industry.Approach 1: Tarkett Discounted Cash Flow (DCF) Analysis
The Discounted Cash Flow (DCF) model focuses on forecasting the company's future cash flows and translating those future values into today's terms. The goal is to estimate how much cash Tarkett will generate in the coming years, then discount those amounts back to their present value to determine a fair price for the stock today.
Currently, Tarkett's last twelve months Free Cash Flow stands at €142.7 million. Projections for the next decade suggest some volatility, with analysts estimating a gradual decline before returning to modest growth. For example, Free Cash Flow is expected to be €132.8 million in 2026, decreasing marginally over the following years and reaching around €128.9 million by 2035. These projections incorporate industry expectations, company performance, and broader economic trends.
Based on these long-range forecasts, the DCF-derived intrinsic value per share is €22.48. Compared to the current share price, this suggests Tarkett is trading at a 27.3% discount, indicating meaningful upside potential for investors.
Result: UNDERVALUED
Head to the Valuation section of our Company Report for more details on how we arrive at this Fair Value for Tarkett.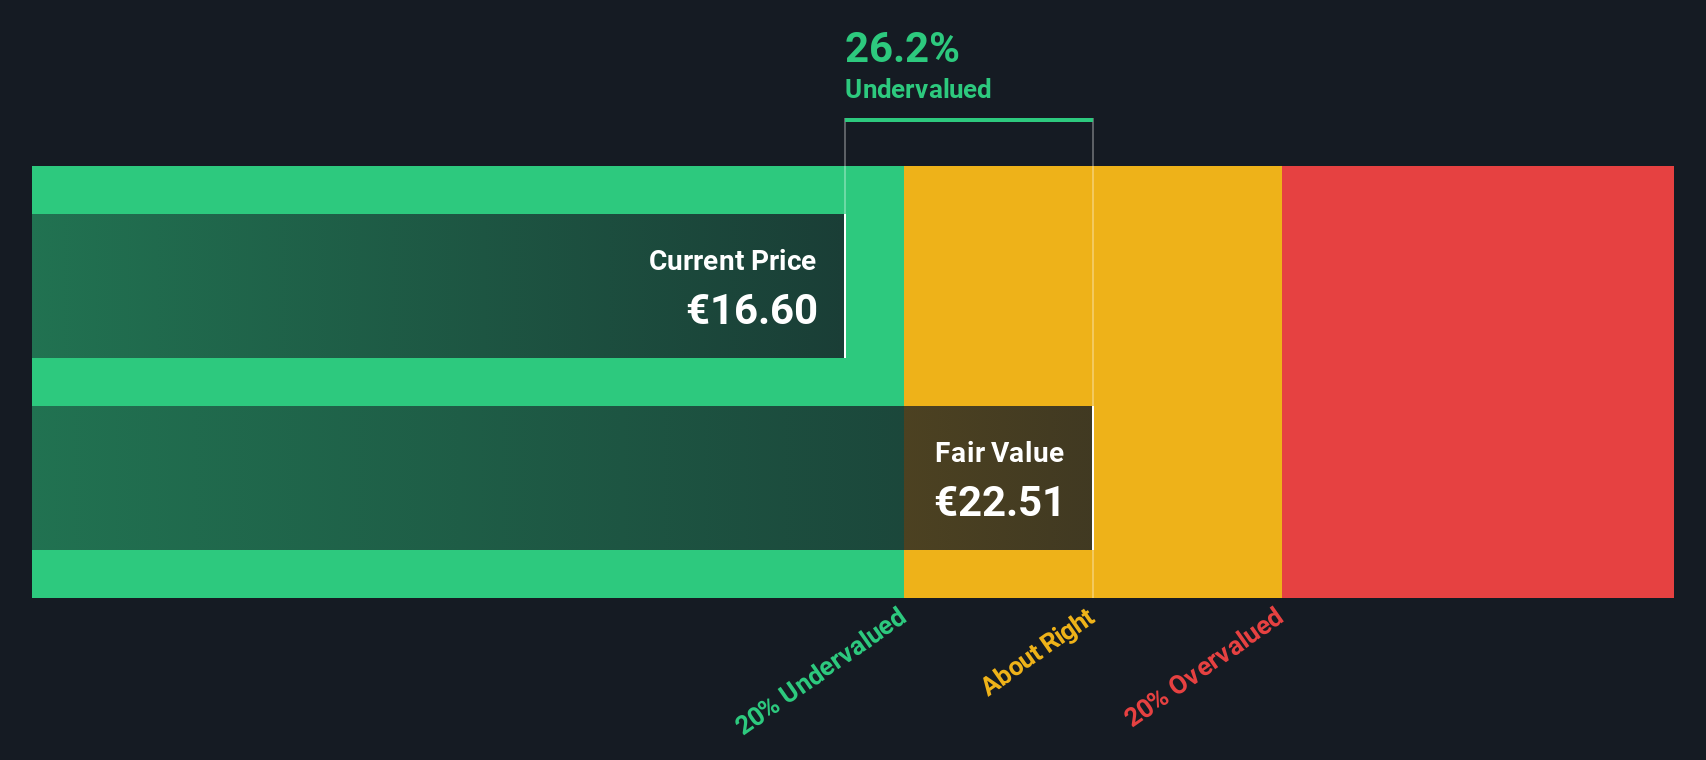
Approach 2: Tarkett Price vs Sales
When evaluating companies like Tarkett, the Price-to-Sales (P/S) ratio is a useful metric, especially for businesses that may not have consistently positive earnings but do have steady revenue. The P/S ratio helps investors assess how much they are paying for each euro of sales, which is particularly relevant in the building industry where revenue trends can reveal more than bottom-line profits.
Growth expectations and business risks also play a big role in determining what is considered a “fair” P/S ratio. Rapidly growing companies or those with very stable revenues typically command higher P/S ratios because investors expect profits to rise or volatility to stay low. Higher perceived risks, in contrast, tend to suppress the multiple investors are willing to pay for each euro in sales.
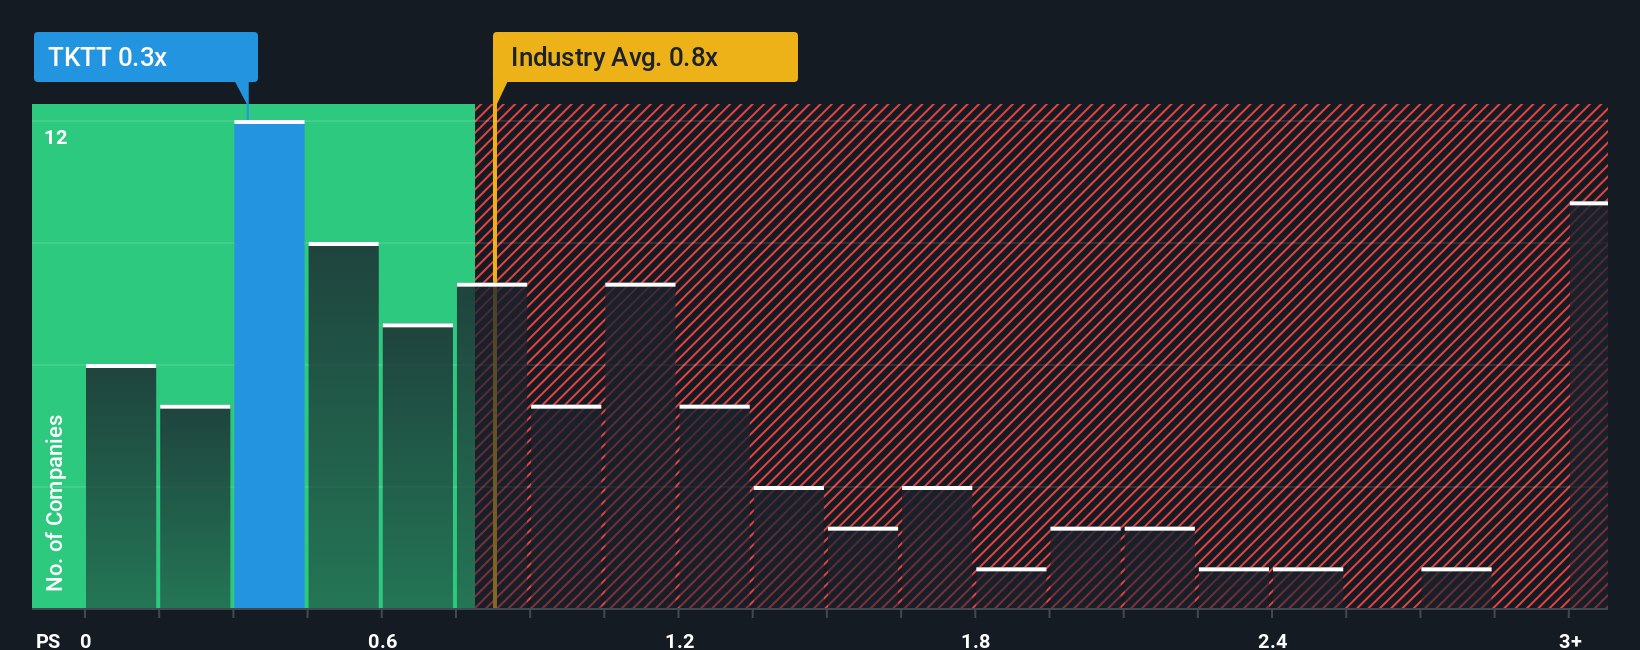
Right now, Tarkett’s P/S ratio is just 0.32x. This is well below both the building industry’s average of 1.08x and the peer group average of 0.58x. At first glance, this steep discount might suggest the stock is undervalued. To get a more nuanced view, Simply Wall St’s proprietary “Fair Ratio” goes beyond industry and peer benchmarks. By accounting for factors like Tarkett’s revenue growth, industry characteristics, profit margins, market capitalization, and relevant risk factors, the Fair Ratio provides a tailored benchmark for what the company’s P/S should actually be.
This approach is generally more reliable than relying solely on industry or peer averages because it considers the full picture of company performance and outlook. In this case, with Tarkett’s actual P/S ratio at 0.32x and the Fair Ratio calculated at a similar level, the valuation appears balanced rather than presenting a clear bargain or risk. This suggests that, compared with its fair value benchmark, the stock is trading where it should be based on its current fundamentals.
Result: ABOUT RIGHT
Upgrade Your Decision Making: Choose your Tarkett Narrative
Earlier, we mentioned there is an even better way to understand valuation. Let’s introduce you to Narratives. A Narrative is your own story about a company; it's how you tie together your views on Tarkett’s future revenue, profits, and margins, then connect that outlook to a fair value estimate. Narratives link the big picture (why Tarkett could grow or face challenges) to what those beliefs mean for the numbers, so you are not just relying on static calculations but on insights that truly reflect your perspective.
Narratives are a powerful and simple tool available to everyone through the Simply Wall St Community page, where millions of investors share and compare their perspectives. By building a Narrative, you see at a glance whether your Fair Value suggests buying or waiting, based on today's market price. Narratives update in real time as fresh earnings, news, or sector changes come in, giving you an always-current way to decide.
For example, on Tarkett, one investor’s Narrative might forecast strong international growth and see much greater upside, while another expects flat revenue and a lower fair value. Both views are visible and easy to follow, letting you find the story that matches your thinking.
Do you think there's more to the story for Tarkett? Create your own Narrative to let the Community know!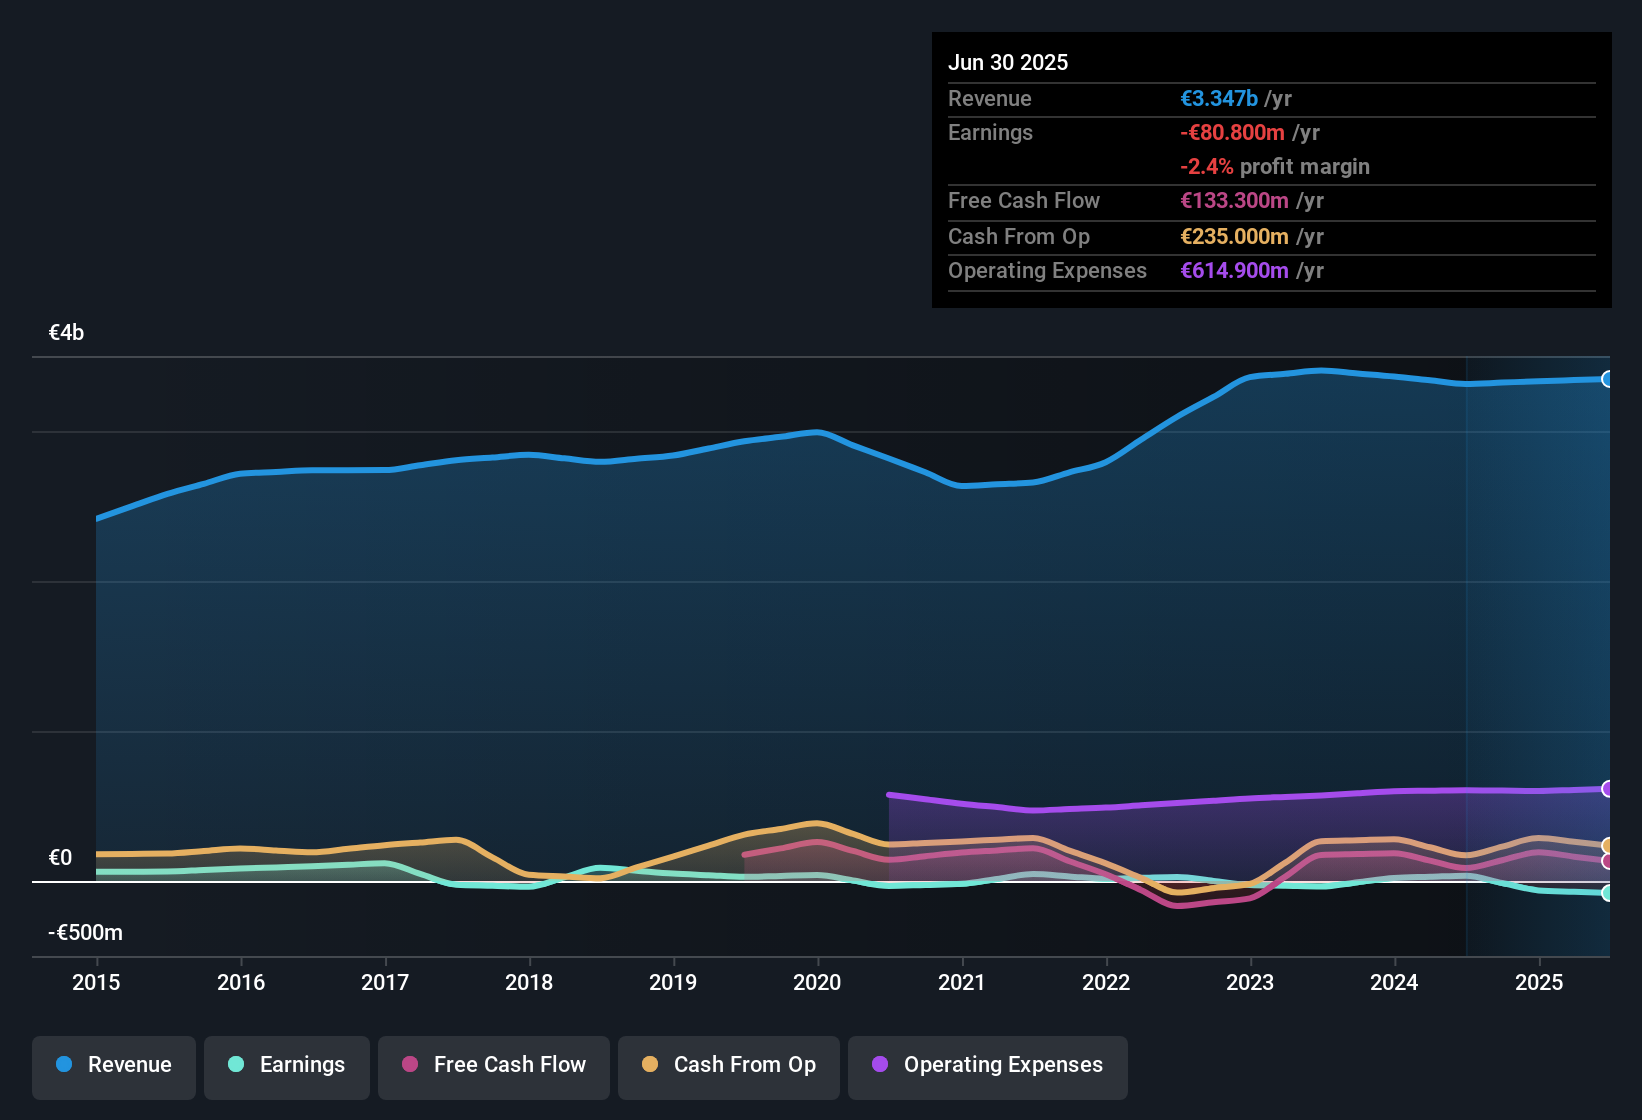
This article by Simply Wall St is general in nature. We provide commentary based on historical data and analyst forecasts only using an unbiased methodology and our articles are not intended to be financial advice. It does not constitute a recommendation to buy or sell any stock, and does not take account of your objectives, or your financial situation. We aim to bring you long-term focused analysis driven by fundamental data. Note that our analysis may not factor in the latest price-sensitive company announcements or qualitative material. Simply Wall St has no position in any stocks mentioned.
Valuation is complex, but we're here to simplify it.
Discover if Tarkett might be undervalued or overvalued with our detailed analysis, featuring fair value estimates, potential risks, dividends, insider trades, and its financial condition.
Access Free AnalysisHave feedback on this article? Concerned about the content? Get in touch with us directly. Alternatively, email editorial-team@simplywallst.com
About ENXTPA:TKTT
Tarkett
Provides flooring and sports surface solutions to businesses and residential end users in Europe, the Middle East, Africa, North America, the Commonwealth of Independent States, the Asia Pacific, and Latin America.
Good value with adequate balance sheet.
Similar Companies
Market Insights

Advertisement
Community Narratives
America Wants Homegrown Drones — Draganfly Is Ready to Deliver
Fair Value US$9.21|33.8% undervalued
JO
Community Contributor
Cheesecake Factory offers an enticing opportunity for long-term growth by leveraging new concepts
Fair Value US$73.83|27.0% undervalued
ZW
Community Contributor
Coca-Cola’s Intrinsic Value Set to Rise with Fed Rate Cut
Fair Value US$67.50|1.9% undervalued
AL
Community Contributor
Fully Permitted Gold Mine with 50 Baggers Potential 
Fair Value CA$41.00|98.6% undervalued
RO
Community Contributor