
Advertisement
Manitou BF SA (EPA:MTU) Shares Could Be 42% Below Their Intrinsic Value Estimate
Key Insights
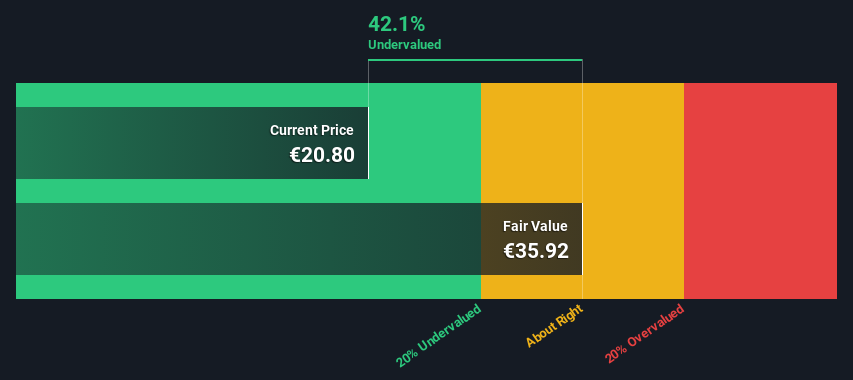
- Using the 2 Stage Free Cash Flow to Equity, Manitou BF fair value estimate is €35.92
- Manitou BF's €20.80 share price signals that it might be 42% undervalued
- Analyst price target for MTU is €30.25 which is 16% below our fair value estimate
How far off is Manitou BF SA (EPA:MTU) from its intrinsic value? Using the most recent financial data, we'll take a look at whether the stock is fairly priced by taking the forecast future cash flows of the company and discounting them back to today's value. We will use the Discounted Cash Flow (DCF) model on this occasion. Models like these may appear beyond the comprehension of a lay person, but they're fairly easy to follow.
We generally believe that a company's value is the present value of all of the cash it will generate in the future. However, a DCF is just one valuation metric among many, and it is not without flaws. If you want to learn more about discounted cash flow, the rationale behind this calculation can be read in detail in the Simply Wall St analysis model.
Check out our latest analysis for Manitou BF
The Calculation
We are going to use a two-stage DCF model, which, as the name states, takes into account two stages of growth. The first stage is generally a higher growth period which levels off heading towards the terminal value, captured in the second 'steady growth' period. To begin with, we have to get estimates of the next ten years of cash flows. Where possible we use analyst estimates, but when these aren't available we extrapolate the previous free cash flow (FCF) from the last estimate or reported value. We assume companies with shrinking free cash flow will slow their rate of shrinkage, and that companies with growing free cash flow will see their growth rate slow, over this period. We do this to reflect that growth tends to slow more in the early years than it does in later years.
Generally we assume that a dollar today is more valuable than a dollar in the future, and so the sum of these future cash flows is then discounted to today's value:
10-year free cash flow (FCF) estimate
| 2024 | 2025 | 2026 | 2027 | 2028 | 2029 | 2030 | 2031 | 2032 | 2033 | |
| Levered FCF (€, Millions) | €67.3m | €80.6m | €90.1m | €97.8m | €103.9m | €108.7m | €112.5m | €115.5m | €118.0m | €120.1m |
| Growth Rate Estimate Source | Analyst x3 | Analyst x3 | Est @ 11.81% | Est @ 8.52% | Est @ 6.22% | Est @ 4.62% | Est @ 3.49% | Est @ 2.70% | Est @ 2.15% | Est @ 1.76% |
| Present Value (€, Millions) Discounted @ 8.3% | €62.2 | €68.7 | €70.9 | €71.0 | €69.6 | €67.2 | €64.2 | €60.9 | €57.4 | €53.9 |
("Est" = FCF growth rate estimated by Simply Wall St)
Present Value of 10-year Cash Flow (PVCF) = €646m
The second stage is also known as Terminal Value, this is the business's cash flow after the first stage. For a number of reasons a very conservative growth rate is used that cannot exceed that of a country's GDP growth. In this case we have used the 5-year average of the 10-year government bond yield (0.9%) to estimate future growth. In the same way as with the 10-year 'growth' period, we discount future cash flows to today's value, using a cost of equity of 8.3%.
Terminal Value (TV)= FCF2033 × (1 + g) ÷ (r – g) = €120m× (1 + 0.9%) ÷ (8.3%– 0.9%) = €1.6b
Present Value of Terminal Value (PVTV)= TV / (1 + r)10= €1.6b÷ ( 1 + 8.3%)10= €728m
The total value is the sum of cash flows for the next ten years plus the discounted terminal value, which results in the Total Equity Value, which in this case is €1.4b. The last step is to then divide the equity value by the number of shares outstanding. Relative to the current share price of €20.8, the company appears quite good value at a 42% discount to where the stock price trades currently. Remember though, that this is just an approximate valuation, and like any complex formula - garbage in, garbage out.
Important Assumptions
Now the most important inputs to a discounted cash flow are the discount rate, and of course, the actual cash flows. You don't have to agree with these inputs, I recommend redoing the calculations yourself and playing with them. The DCF also does not consider the possible cyclicality of an industry, or a company's future capital requirements, so it does not give a full picture of a company's potential performance. Given that we are looking at Manitou BF as potential shareholders, the cost of equity is used as the discount rate, rather than the cost of capital (or weighted average cost of capital, WACC) which accounts for debt. In this calculation we've used 8.3%, which is based on a levered beta of 1.299. Beta is a measure of a stock's volatility, compared to the market as a whole. We get our beta from the industry average beta of globally comparable companies, with an imposed limit between 0.8 and 2.0, which is a reasonable range for a stable business.
SWOT Analysis for Manitou BF
Strength
- Earnings growth over the past year exceeded the industry.
- Debt is well covered by earnings.
Weakness
- Dividend is low compared to the top 25% of dividend payers in the Machinery market.
Opportunity
- Annual earnings are forecast to grow faster than the French market.
- Good value based on P/E ratio and estimated fair value.
Threat
- Debt is not well covered by operating cash flow.
- Paying a dividend but company has no free cash flows.
- Revenue is forecast to grow slower than 20% per year.
Looking Ahead:
Whilst important, the DCF calculation is only one of many factors that you need to assess for a company. DCF models are not the be-all and end-all of investment valuation. Preferably you'd apply different cases and assumptions and see how they would impact the company's valuation. For example, changes in the company's cost of equity or the risk free rate can significantly impact the valuation. What is the reason for the share price sitting below the intrinsic value? For Manitou BF, there are three relevant aspects you should consider:
- Risks: Take risks, for example - Manitou BF has 3 warning signs (and 2 which don't sit too well with us) we think you should know about.
- Future Earnings: How does MTU's growth rate compare to its peers and the wider market? Dig deeper into the analyst consensus number for the upcoming years by interacting with our free analyst growth expectation chart.
- Other High Quality Alternatives: Do you like a good all-rounder? Explore our interactive list of high quality stocks to get an idea of what else is out there you may be missing!
PS. The Simply Wall St app conducts a discounted cash flow valuation for every stock on the ENXTPA every day. If you want to find the calculation for other stocks just search here.
New: Manage All Your Stock Portfolios in One Place
We've created the ultimate portfolio companion for stock investors, and it's free.
• Connect an unlimited number of Portfolios and see your total in one currency
• Be alerted to new Warning Signs or Risks via email or mobile
• Track the Fair Value of your stocks
Have feedback on this article? Concerned about the content? Get in touch with us directly. Alternatively, email editorial-team (at) simplywallst.com.
This article by Simply Wall St is general in nature. We provide commentary based on historical data and analyst forecasts only using an unbiased methodology and our articles are not intended to be financial advice. It does not constitute a recommendation to buy or sell any stock, and does not take account of your objectives, or your financial situation. We aim to bring you long-term focused analysis driven by fundamental data. Note that our analysis may not factor in the latest price-sensitive company announcements or qualitative material. Simply Wall St has no position in any stocks mentioned.
About ENXTPA:MTU
Manitou BF
Engages in the development, manufacture, and distribution of equipment and services in the France, Southern Europe, Northern Europe, the Americas, Asia, the Pacific, Africa, and the Middle East.
Flawless balance sheet, undervalued and pays a dividend.
Similar Companies
Market Insights

Advertisement
Community Narratives
Finding The True Value Of A Logistics Powerhouse
Fair Value US$95.21|8.7% undervalued
NV
Community Contributor
Paradigm Biopharmaceuticals Will Lead Osteoarthritis Treatment with Zilosul's FDA Success
Fair Value AU$5.50|93.3% undervalued
AM
Community Contributor
Barrick Mining (ABX:CA): A Gold Hedge against a U.S. Shutdown
Fair Value CA$60.00|18.7% undervalued
GM
Community Contributor