
Advertisement

There are a few key trends to look for if we want to identify the next multi-bagger. Amongst other things, we'll want to see two things; firstly, a growing return on capital employed (ROCE) and secondly, an expansion in the company's amount of capital employed. Basically this means that a company has profitable initiatives that it can continue to reinvest in, which is a trait of a compounding machine. Although, when we looked at Bouygues (EPA:EN), it didn't seem to tick all of these boxes.
Return On Capital Employed (ROCE): What Is It?
For those who don't know, ROCE is a measure of a company's yearly pre-tax profit (its return), relative to the capital employed in the business. Analysts use this formula to calculate it for Bouygues:
Return on Capital Employed = Earnings Before Interest and Tax (EBIT) ÷ (Total Assets - Current Liabilities)
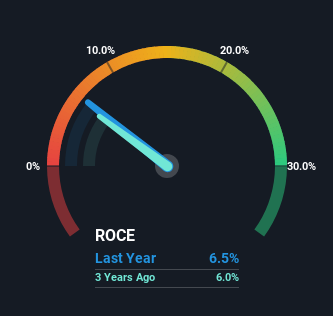
0.065 = €2.0b ÷ (€61b - €30b) (Based on the trailing twelve months to December 2023).
So, Bouygues has an ROCE of 6.5%. In absolute terms, that's a low return and it also under-performs the Construction industry average of 10%.
Check out our latest analysis for Bouygues
In the above chart we have measured Bouygues' prior ROCE against its prior performance, but the future is arguably more important. If you'd like to see what analysts are forecasting going forward, you should check out our free analyst report for Bouygues .
What The Trend Of ROCE Can Tell Us
There are better returns on capital out there than what we're seeing at Bouygues. Over the past five years, ROCE has remained relatively flat at around 6.5% and the business has deployed 54% more capital into its operations. Given the company has increased the amount of capital employed, it appears the investments that have been made simply don't provide a high return on capital.
Another thing to note, Bouygues has a high ratio of current liabilities to total assets of 50%. This can bring about some risks because the company is basically operating with a rather large reliance on its suppliers or other sorts of short-term creditors. While it's not necessarily a bad thing, it can be beneficial if this ratio is lower.
The Key Takeaway
In summary, Bouygues has simply been reinvesting capital and generating the same low rate of return as before. Although the market must be expecting these trends to improve because the stock has gained 45% over the last five years. But if the trajectory of these underlying trends continue, we think the likelihood of it being a multi-bagger from here isn't high.
One more thing to note, we've identified 1 warning sign with Bouygues and understanding it should be part of your investment process.
For those who like to invest in solid companies, check out this free list of companies with solid balance sheets and high returns on equity.
Valuation is complex, but we're here to simplify it.
Discover if Bouygues might be undervalued or overvalued with our detailed analysis, featuring fair value estimates, potential risks, dividends, insider trades, and its financial condition.
Access Free AnalysisHave feedback on this article? Concerned about the content? Get in touch with us directly. Alternatively, email editorial-team (at) simplywallst.com.
This article by Simply Wall St is general in nature. We provide commentary based on historical data and analyst forecasts only using an unbiased methodology and our articles are not intended to be financial advice. It does not constitute a recommendation to buy or sell any stock, and does not take account of your objectives, or your financial situation. We aim to bring you long-term focused analysis driven by fundamental data. Note that our analysis may not factor in the latest price-sensitive company announcements or qualitative material. Simply Wall St has no position in any stocks mentioned.
About ENXTPA:EN
Bouygues
Operates in the construction, energy, telecom, media, and transport infrastructure sectors in France and internationally.
6 star dividend payer and fair value.
Similar Companies
Market Insights

Advertisement
Community Narratives
Nike's Direct-to-Consumer Focus Will Drive Future Growth
Fair Value US$87.90|18.2% undervalued
UN
Community Contributor
Novo Nordisk will dominate GLP-1 market with Ozempic and Wegovy growth
Fair Value US$89.59|12.1% undervalued
BE
Community Contributor
Rheinmetall could get 20-25% of EU-NATO 3%-GDP defence spending
Fair Value €7.57k|82.4% undervalued
NO
Community Contributor