
Advertisement
Market Participants Recognise Cerinnov Group SA's (EPA:ALPCV) Revenues Pushing Shares 27% Higher

Cerinnov Group SA (EPA:ALPCV) shareholders are no doubt pleased to see that the share price has bounced 27% in the last month, although it is still struggling to make up recently lost ground. Still, the 30-day jump doesn't change the fact that longer term shareholders have seen their stock decimated by the 57% share price drop in the last twelve months.
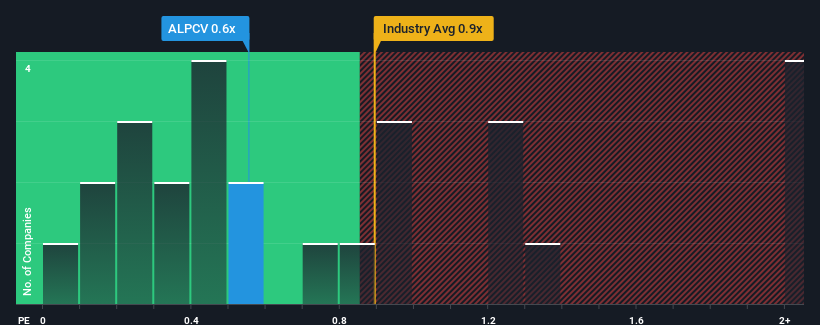
In spite of the firm bounce in price, you could still be forgiven for feeling indifferent about Cerinnov Group's P/S ratio of 0.6x, since the median price-to-sales (or "P/S") ratio for the Machinery industry in France is also close to 0.9x. However, investors might be overlooking a clear opportunity or potential setback if there is no rational basis for the P/S.
Check out our latest analysis for Cerinnov Group
How Cerinnov Group Has Been Performing
Cerinnov Group hasn't been tracking well recently as its declining revenue compares poorly to other companies, which have seen some growth in their revenues on average. Perhaps the market is expecting its poor revenue performance to improve, keeping the P/S from dropping. If not, then existing shareholders may be a little nervous about the viability of the share price.
If you'd like to see what analysts are forecasting going forward, you should check out our free report on Cerinnov Group.What Are Revenue Growth Metrics Telling Us About The P/S?
Cerinnov Group's P/S ratio would be typical for a company that's only expected to deliver moderate growth, and importantly, perform in line with the industry.
If we review the last year of revenue, the company posted a result that saw barely any deviation from a year ago. Still, the latest three year period has seen an excellent 87% overall rise in revenue, in spite of its uninspiring short-term performance. Accordingly, shareholders will be pleased, but also have some questions to ponder about the last 12 months.
Turning to the outlook, the next year should generate growth of 5.9% as estimated by the only analyst watching the company. That's shaping up to be similar to the 4.2% growth forecast for the broader industry.
With this in mind, it makes sense that Cerinnov Group's P/S is closely matching its industry peers. Apparently shareholders are comfortable to simply hold on while the company is keeping a low profile.
The Bottom Line On Cerinnov Group's P/S
Its shares have lifted substantially and now Cerinnov Group's P/S is back within range of the industry median. We'd say the price-to-sales ratio's power isn't primarily as a valuation instrument but rather to gauge current investor sentiment and future expectations.
Our look at Cerinnov Group's revenue growth estimates show that its P/S is about what we expect, as both metrics follow closely with the industry averages. At this stage investors feel the potential for an improvement or deterioration in revenue isn't great enough to push P/S in a higher or lower direction. All things considered, if the P/S and revenue estimates contain no major shocks, then it's hard to see the share price moving strongly in either direction in the near future.
You should always think about risks. Case in point, we've spotted 5 warning signs for Cerinnov Group you should be aware of, and 1 of them is a bit unpleasant.
If these risks are making you reconsider your opinion on Cerinnov Group, explore our interactive list of high quality stocks to get an idea of what else is out there.
New: AI Stock Screener & Alerts
Our new AI Stock Screener scans the market every day to uncover opportunities.
• Dividend Powerhouses (3%+ Yield)
• Undervalued Small Caps with Insider Buying
• High growth Tech and AI Companies
Or build your own from over 50 metrics.
Have feedback on this article? Concerned about the content? Get in touch with us directly. Alternatively, email editorial-team (at) simplywallst.com.
This article by Simply Wall St is general in nature. We provide commentary based on historical data and analyst forecasts only using an unbiased methodology and our articles are not intended to be financial advice. It does not constitute a recommendation to buy or sell any stock, and does not take account of your objectives, or your financial situation. We aim to bring you long-term focused analysis driven by fundamental data. Note that our analysis may not factor in the latest price-sensitive company announcements or qualitative material. Simply Wall St has no position in any stocks mentioned.
About ENXTPA:ALPCV
Cerinnov Group
Designs, manufactures, and markets of machines and equipment for the ceramics, heat treatment, and glass industries in France, rest of Europe, the Americas, Asia, Oceania, and the Middle East.
Low and slightly overvalued.
Market Insights

Advertisement
Community Narratives
Groundbreaking therapies that could change the treatment landscape for PTSD, fibromyalgia, MS & Alzheimer’s
Fair Value US$6.20|86.9% undervalued
CM
Community Contributor
DigitalOcean Will Grow 14% by Embracing AI with Paperspace Acquisition
Fair Value US$50.00|42.8% undervalued
NE
Community Contributor
Viant Technology: A Rising AdTech Challenger in the AI-Powered CTV Market
Fair Value US$38.61|66.0% undervalued
BL
Community Contributor
Volvo will Accelerate Forward into Electric and Autonomous Leadership in Five Years
Fair Value SEK 438.80|40.1% undervalued
UN
Community Contributor