Cerinnov Group's (EPA:ALPCV) Returns On Capital Are Heading Higher


What trends should we look for it we want to identify stocks that can multiply in value over the long term? Typically, we'll want to notice a trend of growing return on capital employed (ROCE) and alongside that, an expanding base of capital employed. Ultimately, this demonstrates that it's a business that is reinvesting profits at increasing rates of return. Speaking of which, we noticed some great changes in Cerinnov Group's (EPA:ALPCV) returns on capital, so let's have a look.
What Is Return On Capital Employed (ROCE)?
Just to clarify if you're unsure, ROCE is a metric for evaluating how much pre-tax income (in percentage terms) a company earns on the capital invested in its business. To calculate this metric for Cerinnov Group, this is the formula:
Return on Capital Employed = Earnings Before Interest and Tax (EBIT) ÷ (Total Assets - Current Liabilities)
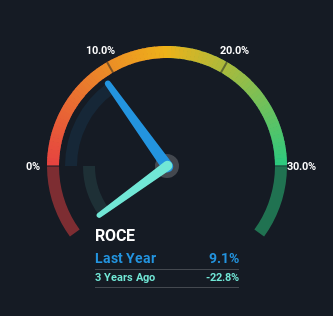
0.091 = €812k ÷ (€18m - €8.9m) (Based on the trailing twelve months to December 2023).
Therefore, Cerinnov Group has an ROCE of 9.1%. On its own, that's a low figure but it's around the 8.4% average generated by the Machinery industry.
View our latest analysis for Cerinnov Group
In the above chart we have measured Cerinnov Group's prior ROCE against its prior performance, but the future is arguably more important. If you'd like, you can check out the forecasts from the analysts covering Cerinnov Group for free.
What The Trend Of ROCE Can Tell Us
It's great to see that Cerinnov Group has started to generate some pre-tax earnings from prior investments. While the business is profitable now, it used to be incurring losses on invested capital five years ago. At first glance, it seems the business is getting more proficient at generating returns, because over the same period, the amount of capital employed has reduced by 50%. This could potentially mean that the company is selling some of its assets.
For the record though, there was a noticeable increase in the company's current liabilities over the period, so we would attribute some of the ROCE growth to that. The current liabilities has increased to 50% of total assets, so the business is now more funded by the likes of its suppliers or short-term creditors. Given it's pretty high ratio, we'd remind investors that having current liabilities at those levels can bring about some risks in certain businesses.
The Key Takeaway
In summary, it's great to see that Cerinnov Group has been able to turn things around and earn higher returns on lower amounts of capital. Given the stock has declined 42% in the last five years, this could be a good investment if the valuation and other metrics are also appealing. That being the case, research into the company's current valuation metrics and future prospects seems fitting.
Cerinnov Group does have some risks, we noticed 5 warning signs (and 1 which doesn't sit too well with us) we think you should know about.
While Cerinnov Group may not currently earn the highest returns, we've compiled a list of companies that currently earn more than 25% return on equity. Check out this free list here.
If you're looking to trade Cerinnov Group, open an account with the lowest-cost platform trusted by professionals, Interactive Brokers.
With clients in over 200 countries and territories, and access to 160 markets, IBKR lets you trade stocks, options, futures, forex, bonds and funds from a single integrated account.
Enjoy no hidden fees, no account minimums, and FX conversion rates as low as 0.03%, far better than what most brokers offer.
Sponsored ContentNew: AI Stock Screener & Alerts
Our new AI Stock Screener scans the market every day to uncover opportunities.
• Dividend Powerhouses (3%+ Yield)
• Undervalued Small Caps with Insider Buying
• High growth Tech and AI Companies
Or build your own from over 50 metrics.
Have feedback on this article? Concerned about the content? Get in touch with us directly. Alternatively, email editorial-team (at) simplywallst.com.
This article by Simply Wall St is general in nature. We provide commentary based on historical data and analyst forecasts only using an unbiased methodology and our articles are not intended to be financial advice. It does not constitute a recommendation to buy or sell any stock, and does not take account of your objectives, or your financial situation. We aim to bring you long-term focused analysis driven by fundamental data. Note that our analysis may not factor in the latest price-sensitive company announcements or qualitative material. Simply Wall St has no position in any stocks mentioned.
About ENXTPA:ALPCV
Cerinnov Group
Designs, manufactures, and markets of machines and equipment for the ceramics, heat treatment, and glass industries in France, rest of Europe, the Americas, Asia, Oceania, and the Middle East.
Low and slightly overvalued.
Market Insights

Community Narratives

