
To find a multi-bagger stock, what are the underlying trends we should look for in a business? One common approach is to try and find a company with returns on capital employed (ROCE) that are increasing, in conjunction with a growing amount of capital employed. Basically this means that a company has profitable initiatives that it can continue to reinvest in, which is a trait of a compounding machine. In light of that, when we looked at Airbus (EPA:AIR) and its ROCE trend, we weren't exactly thrilled.
Understanding Return On Capital Employed (ROCE)
Just to clarify if you're unsure, ROCE is a metric for evaluating how much pre-tax income (in percentage terms) a company earns on the capital invested in its business. The formula for this calculation on Airbus is:
Return on Capital Employed = Earnings Before Interest and Tax (EBIT) ÷ (Total Assets - Current Liabilities)
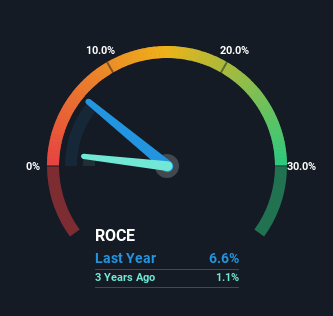
0.066 = €4.3b ÷ (€119b - €54b) (Based on the trailing twelve months to December 2023).
Therefore, Airbus has an ROCE of 6.6%. In absolute terms, that's a low return and it also under-performs the Aerospace & Defense industry average of 10%.
Check out our latest analysis for Airbus
Above you can see how the current ROCE for Airbus compares to its prior returns on capital, but there's only so much you can tell from the past. If you're interested, you can view the analysts predictions in our free analyst report for Airbus .
So How Is Airbus' ROCE Trending?
Over the past five years, Airbus' ROCE and capital employed have both remained mostly flat. This tells us the company isn't reinvesting in itself, so it's plausible that it's past the growth phase. So don't be surprised if Airbus doesn't end up being a multi-bagger in a few years time. With fewer investment opportunities, it makes sense that Airbus has been paying out a decent 37% of its earnings to shareholders. Given the business isn't reinvesting in itself, it makes sense to distribute a portion of earnings among shareholders.
On a separate but related note, it's important to know that Airbus has a current liabilities to total assets ratio of 45%, which we'd consider pretty high. This can bring about some risks because the company is basically operating with a rather large reliance on its suppliers or other sorts of short-term creditors. While it's not necessarily a bad thing, it can be beneficial if this ratio is lower.
The Bottom Line
We can conclude that in regards to Airbus' returns on capital employed and the trends, there isn't much change to report on. Since the stock has gained an impressive 43% over the last five years, investors must think there's better things to come. However, unless these underlying trends turn more positive, we wouldn't get our hopes up too high.
If you're still interested in Airbus it's worth checking out our FREE intrinsic value approximation for AIR to see if it's trading at an attractive price in other respects.
If you want to search for solid companies with great earnings, check out this free list of companies with good balance sheets and impressive returns on equity.
New: Manage All Your Stock Portfolios in One Place
We've created the ultimate portfolio companion for stock investors, and it's free.
• Connect an unlimited number of Portfolios and see your total in one currency
• Be alerted to new Warning Signs or Risks via email or mobile
• Track the Fair Value of your stocks
Have feedback on this article? Concerned about the content? Get in touch with us directly. Alternatively, email editorial-team (at) simplywallst.com.
This article by Simply Wall St is general in nature. We provide commentary based on historical data and analyst forecasts only using an unbiased methodology and our articles are not intended to be financial advice. It does not constitute a recommendation to buy or sell any stock, and does not take account of your objectives, or your financial situation. We aim to bring you long-term focused analysis driven by fundamental data. Note that our analysis may not factor in the latest price-sensitive company announcements or qualitative material. Simply Wall St has no position in any stocks mentioned.
About ENXTPA:AIR
Airbus
Engages in the design, manufacture, and delivery of aerospace products, services, and solutions worldwide.
Flawless balance sheet with reasonable growth potential.
Similar Companies
Market Insights

Community Narratives

