
Advertisement
Heeros Oyj (HEL:HEEROS) Stock Rockets 34% As Investors Are Less Pessimistic Than Expected

The Heeros Oyj (HEL:HEEROS) share price has done very well over the last month, posting an excellent gain of 34%. Notwithstanding the latest gain, the annual share price return of 8.5% isn't as impressive.
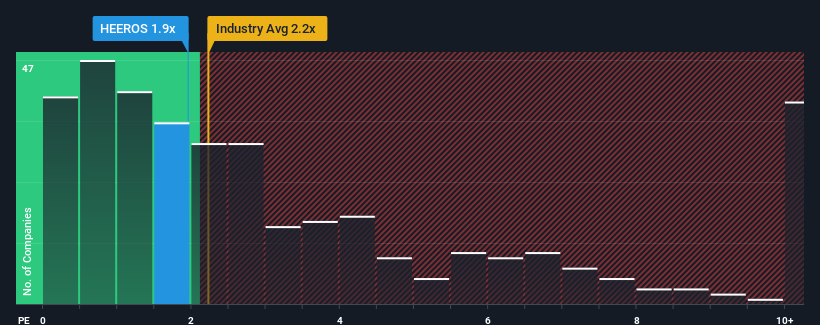
In spite of the firm bounce in price, there still wouldn't be many who think Heeros Oyj's price-to-sales (or "P/S") ratio of 1.9x is worth a mention when the median P/S in Finland's Software industry is similar at about 1.7x. While this might not raise any eyebrows, if the P/S ratio is not justified investors could be missing out on a potential opportunity or ignoring looming disappointment.
View our latest analysis for Heeros Oyj
What Does Heeros Oyj's P/S Mean For Shareholders?
It looks like revenue growth has deserted Heeros Oyj recently, which is not something to boast about. It might be that many expect the uninspiring revenue performance to only match most other companies at best over the coming period, which has kept the P/S from rising. If you like the company, you'd be hoping this isn't the case so that you could potentially pick up some stock while it's not quite in favour.
Want the full picture on earnings, revenue and cash flow for the company? Then our free report on Heeros Oyj will help you shine a light on its historical performance.Do Revenue Forecasts Match The P/S Ratio?
The only time you'd be comfortable seeing a P/S like Heeros Oyj's is when the company's growth is tracking the industry closely.
Taking a look back first, we see that there was hardly any revenue growth to speak of for the company over the past year. Still, the latest three year period was better as it's delivered a decent 27% overall rise in revenue. Therefore, it's fair to say that revenue growth has been inconsistent recently for the company.
Comparing the recent medium-term revenue trends against the industry's one-year growth forecast of 17% shows it's noticeably less attractive.
In light of this, it's curious that Heeros Oyj's P/S sits in line with the majority of other companies. It seems most investors are ignoring the fairly limited recent growth rates and are willing to pay up for exposure to the stock. They may be setting themselves up for future disappointment if the P/S falls to levels more in line with recent growth rates.
The Key Takeaway
Heeros Oyj appears to be back in favour with a solid price jump bringing its P/S back in line with other companies in the industry Typically, we'd caution against reading too much into price-to-sales ratios when settling on investment decisions, though it can reveal plenty about what other market participants think about the company.
Our examination of Heeros Oyj revealed its poor three-year revenue trends aren't resulting in a lower P/S as per our expectations, given they look worse than current industry outlook. Right now we are uncomfortable with the P/S as this revenue performance isn't likely to support a more positive sentiment for long. If recent medium-term revenue trends continue, the probability of a share price decline will become quite substantial, placing shareholders at risk.
You need to take note of risks, for example - Heeros Oyj has 2 warning signs (and 1 which shouldn't be ignored) we think you should know about.
Of course, profitable companies with a history of great earnings growth are generally safer bets. So you may wish to see this free collection of other companies that have reasonable P/E ratios and have grown earnings strongly.
Valuation is complex, but we're here to simplify it.
Discover if Heeros Oyj might be undervalued or overvalued with our detailed analysis, featuring fair value estimates, potential risks, dividends, insider trades, and its financial condition.
Access Free AnalysisHave feedback on this article? Concerned about the content? Get in touch with us directly. Alternatively, email editorial-team (at) simplywallst.com.
This article by Simply Wall St is general in nature. We provide commentary based on historical data and analyst forecasts only using an unbiased methodology and our articles are not intended to be financial advice. It does not constitute a recommendation to buy or sell any stock, and does not take account of your objectives, or your financial situation. We aim to bring you long-term focused analysis driven by fundamental data. Note that our analysis may not factor in the latest price-sensitive company announcements or qualitative material. Simply Wall St has no position in any stocks mentioned.
Have feedback on this article? Concerned about the content? Get in touch with us directly. Alternatively, email editorial-team@simplywallst.com
About HLSE:HEEROS
Solid track record with excellent balance sheet.
Market Insights

Advertisement
Community Narratives
Pinterest will surge as advertising innovations ignite revenue growth
Fair Value US$42.63|26.3% undervalued
BR
Community Contributor
Brambles' Revenue Set to Climb 14% with Profit Margins Following
Fair Value AU$21.90|4.9% overvalued
RO
Community Contributor
Challenging Future for STG as Organic Sales Decline by 8.8%
Fair Value DKK 116.13|26.8% undervalued
KA
Community Contributor