

Key Insights
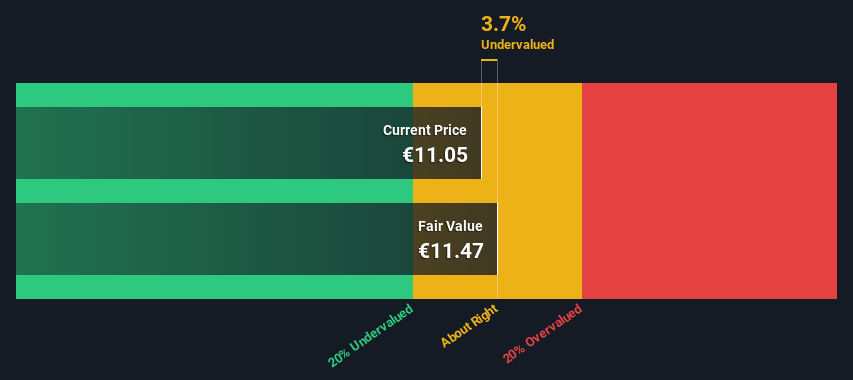
- Iberdrola's estimated fair value is €11.47 based on 2 Stage Free Cash Flow to Equity
- Current share price of €11.05 suggests Iberdrola is potentially trading close to its fair value
- Our fair value estimate is 6.4% lower than Iberdrola's analyst price target of €12.26
Today we'll do a simple run through of a valuation method used to estimate the attractiveness of Iberdrola, S.A. (BME:IBE) as an investment opportunity by estimating the company's future cash flows and discounting them to their present value. We will take advantage of the Discounted Cash Flow (DCF) model for this purpose. Believe it or not, it's not too difficult to follow, as you'll see from our example!
Companies can be valued in a lot of ways, so we would point out that a DCF is not perfect for every situation. If you still have some burning questions about this type of valuation, take a look at the Simply Wall St analysis model.
View our latest analysis for Iberdrola
Is Iberdrola Fairly Valued?
We're using the 2-stage growth model, which simply means we take in account two stages of company's growth. In the initial period the company may have a higher growth rate and the second stage is usually assumed to have a stable growth rate. To start off with, we need to estimate the next ten years of cash flows. Where possible we use analyst estimates, but when these aren't available we extrapolate the previous free cash flow (FCF) from the last estimate or reported value. We assume companies with shrinking free cash flow will slow their rate of shrinkage, and that companies with growing free cash flow will see their growth rate slow, over this period. We do this to reflect that growth tends to slow more in the early years than it does in later years.
A DCF is all about the idea that a dollar in the future is less valuable than a dollar today, and so the sum of these future cash flows is then discounted to today's value:
10-year free cash flow (FCF) estimate
| 2024 | 2025 | 2026 | 2027 | 2028 | 2029 | 2030 | 2031 | 2032 | 2033 | |
| Levered FCF (€, Millions) | -€860.7m | -€166.3m | €783.3m | €2.14b | €3.09b | €3.82b | €4.47b | €5.03b | €5.48b | €5.86b |
| Growth Rate Estimate Source | Analyst x3 | Analyst x3 | Analyst x3 | Analyst x3 | Analyst x1 | Est @ 23.74% | Est @ 17.05% | Est @ 12.37% | Est @ 9.09% | Est @ 6.79% |
| Present Value (€, Millions) Discounted @ 7.0% | -€804 | -€145 | €640 | €1.6k | €2.2k | €2.5k | €2.8k | €2.9k | €3.0k | €3.0k |
("Est" = FCF growth rate estimated by Simply Wall St)
Present Value of 10-year Cash Flow (PVCF) = €18b
The second stage is also known as Terminal Value, this is the business's cash flow after the first stage. For a number of reasons a very conservative growth rate is used that cannot exceed that of a country's GDP growth. In this case we have used the 5-year average of the 10-year government bond yield (1.4%) to estimate future growth. In the same way as with the 10-year 'growth' period, we discount future cash flows to today's value, using a cost of equity of 7.0%.
Terminal Value (TV)= FCF2033 × (1 + g) ÷ (r – g) = €5.9b× (1 + 1.4%) ÷ (7.0%– 1.4%) = €107b
Present Value of Terminal Value (PVTV)= TV / (1 + r)10= €107b÷ ( 1 + 7.0%)10= €54b
The total value, or equity value, is then the sum of the present value of the future cash flows, which in this case is €72b. The last step is to then divide the equity value by the number of shares outstanding. Relative to the current share price of €11.0, the company appears about fair value at a 3.7% discount to where the stock price trades currently. The assumptions in any calculation have a big impact on the valuation, so it is better to view this as a rough estimate, not precise down to the last cent.
Important Assumptions
Now the most important inputs to a discounted cash flow are the discount rate, and of course, the actual cash flows. If you don't agree with these result, have a go at the calculation yourself and play with the assumptions. The DCF also does not consider the possible cyclicality of an industry, or a company's future capital requirements, so it does not give a full picture of a company's potential performance. Given that we are looking at Iberdrola as potential shareholders, the cost of equity is used as the discount rate, rather than the cost of capital (or weighted average cost of capital, WACC) which accounts for debt. In this calculation we've used 7.0%, which is based on a levered beta of 0.800. Beta is a measure of a stock's volatility, compared to the market as a whole. We get our beta from the industry average beta of globally comparable companies, with an imposed limit between 0.8 and 2.0, which is a reasonable range for a stable business.
SWOT Analysis for Iberdrola
- Earnings growth over the past year exceeded its 5-year average.
- Debt is well covered by earnings and cashflows.
- Dividends are covered by earnings and cash flows.
- Earnings growth over the past year underperformed the Electric Utilities industry.
- Dividend is low compared to the top 25% of dividend payers in the Electric Utilities market.
- Annual earnings are forecast to grow for the next 3 years.
- Current share price is below our estimate of fair value.
- Annual earnings are forecast to grow slower than the Spanish market.
Next Steps:
Although the valuation of a company is important, it ideally won't be the sole piece of analysis you scrutinize for a company. It's not possible to obtain a foolproof valuation with a DCF model. Rather it should be seen as a guide to "what assumptions need to be true for this stock to be under/overvalued?" For example, changes in the company's cost of equity or the risk free rate can significantly impact the valuation. For Iberdrola, we've put together three further elements you should assess:
- Risks: For example, we've discovered 1 warning sign for Iberdrola that you should be aware of before investing here.
- Future Earnings: How does IBE's growth rate compare to its peers and the wider market? Dig deeper into the analyst consensus number for the upcoming years by interacting with our free analyst growth expectation chart.
- Other High Quality Alternatives: Do you like a good all-rounder? Explore our interactive list of high quality stocks to get an idea of what else is out there you may be missing!
PS. The Simply Wall St app conducts a discounted cash flow valuation for every stock on the BME every day. If you want to find the calculation for other stocks just search here.
New: AI Stock Screener & Alerts
Our new AI Stock Screener scans the market every day to uncover opportunities.
• Dividend Powerhouses (3%+ Yield)
• Undervalued Small Caps with Insider Buying
• High growth Tech and AI Companies
Or build your own from over 50 metrics.
Have feedback on this article? Concerned about the content? Get in touch with us directly. Alternatively, email editorial-team (at) simplywallst.com.
This article by Simply Wall St is general in nature. We provide commentary based on historical data and analyst forecasts only using an unbiased methodology and our articles are not intended to be financial advice. It does not constitute a recommendation to buy or sell any stock, and does not take account of your objectives, or your financial situation. We aim to bring you long-term focused analysis driven by fundamental data. Note that our analysis may not factor in the latest price-sensitive company announcements or qualitative material. Simply Wall St has no position in any stocks mentioned.
About BME:IBE
Iberdrola
Engages in the generation, transmission, distribution, and supply of electricity in Spain, the United Kingdom, the United States, Mexico, Brazil, Germany, France, and Australia.
Proven track record average dividend payer.
Similar Companies
Market Insights

Community Narratives

