Mapfre's(BME:MAP) Share Price Is Down 39% Over The Past Three Years.


Many investors define successful investing as beating the market average over the long term. But in any portfolio, there are likely to be some stocks that fall short of that benchmark. We regret to report that long term Mapfre, S.A. (BME:MAP) shareholders have had that experience, with the share price dropping 39% in three years, versus a market decline of about 2.0%. In contrast, the stock price has popped 8.6% in the last thirty days. But this could be related to good market conditions, with stocks up around 5.9% during the period.
See our latest analysis for Mapfre
To paraphrase Benjamin Graham: Over the short term the market is a voting machine, but over the long term it's a weighing machine. One imperfect but simple way to consider how the market perception of a company has shifted is to compare the change in the earnings per share (EPS) with the share price movement.
Mapfre saw its EPS decline at a compound rate of 8.8% per year, over the last three years. The share price decline of 15% is actually steeper than the EPS slippage. So it's likely that the EPS decline has disappointed the market, leaving investors hesitant to buy. This increased caution is also evident in the rather low P/E ratio, which is sitting at 9.76.
The company's earnings per share (over time) is depicted in the image below (click to see the exact numbers).
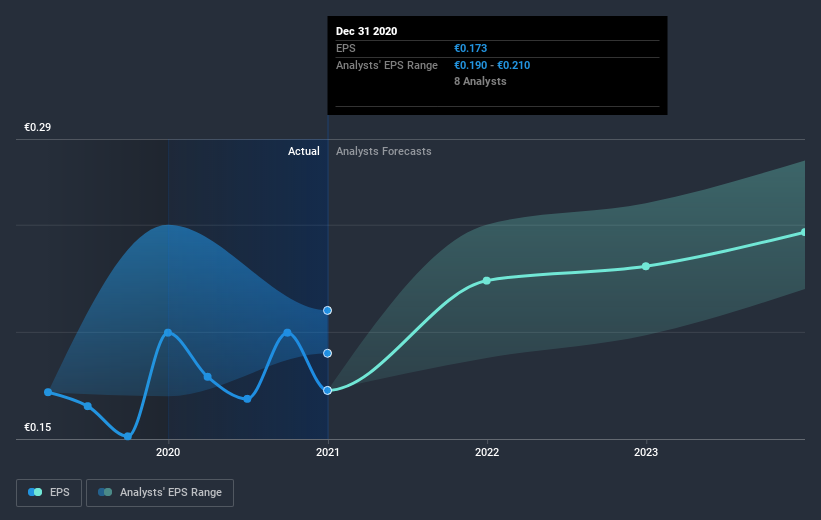
Dive deeper into Mapfre's key metrics by checking this interactive graph of Mapfre's earnings, revenue and cash flow.
What About Dividends?
As well as measuring the share price return, investors should also consider the total shareholder return (TSR). The TSR incorporates the value of any spin-offs or discounted capital raisings, along with any dividends, based on the assumption that the dividends are reinvested. So for companies that pay a generous dividend, the TSR is often a lot higher than the share price return. We note that for Mapfre the TSR over the last 3 years was -29%, which is better than the share price return mentioned above. This is largely a result of its dividend payments!
A Different Perspective
Mapfre shareholders gained a total return of 22% during the year. But that return falls short of the market. On the bright side, that's still a gain, and it's actually better than the average return of 0.7% over half a decade This suggests the company might be improving over time. It's always interesting to track share price performance over the longer term. But to understand Mapfre better, we need to consider many other factors. Like risks, for instance. Every company has them, and we've spotted 2 warning signs for Mapfre (of which 1 shouldn't be ignored!) you should know about.
If you are like me, then you will not want to miss this free list of growing companies that insiders are buying.
Please note, the market returns quoted in this article reflect the market weighted average returns of stocks that currently trade on ES exchanges.
When trading Mapfre or any other investment, use the platform considered by many to be the Professional's Gateway to the Worlds Market, Interactive Brokers. You get the lowest-cost* trading on stocks, options, futures, forex, bonds and funds worldwide from a single integrated account. Promoted
If you're looking to trade Mapfre, open an account with the lowest-cost platform trusted by professionals, Interactive Brokers.
With clients in over 200 countries and territories, and access to 160 markets, IBKR lets you trade stocks, options, futures, forex, bonds and funds from a single integrated account.
Enjoy no hidden fees, no account minimums, and FX conversion rates as low as 0.03%, far better than what most brokers offer.
Sponsored ContentNew: Manage All Your Stock Portfolios in One Place
We've created the ultimate portfolio companion for stock investors, and it's free.
• Connect an unlimited number of Portfolios and see your total in one currency
• Be alerted to new Warning Signs or Risks via email or mobile
• Track the Fair Value of your stocks
This article by Simply Wall St is general in nature. It does not constitute a recommendation to buy or sell any stock, and does not take account of your objectives, or your financial situation. We aim to bring you long-term focused analysis driven by fundamental data. Note that our analysis may not factor in the latest price-sensitive company announcements or qualitative material. Simply Wall St has no position in any stocks mentioned.
*Interactive Brokers Rated Lowest Cost Broker by StockBrokers.com Annual Online Review 2020
Have feedback on this article? Concerned about the content? Get in touch with us directly. Alternatively, email editorial-team (at) simplywallst.com.
About BME:MAP
Mapfre
Engages in the investment, insurance, property, financial, and services businesses in Spain.
Undervalued with solid track record and pays a dividend.
Similar Companies
Market Insights

Community Narratives

