- Spain
- /
- Food and Staples Retail
- /
- BME:DIA
Distribuidora Internacional de Alimentación (BME:DIA) delivers shareholders notable 26% CAGR over 3 years, surging 5.3% in the last week alone


One simple way to benefit from the stock market is to buy an index fund. But many of us dare to dream of bigger returns, and build a portfolio ourselves. For example, the Distribuidora Internacional de Alimentación, S.A. (BME:DIA) share price is up 98% in the last three years, clearly besting the market return of around 54% (not including dividends).
The past week has proven to be lucrative for Distribuidora Internacional de Alimentación investors, so let's see if fundamentals drove the company's three-year performance.
We've discovered 5 warning signs about Distribuidora Internacional de Alimentación. View them for free.To paraphrase Benjamin Graham: Over the short term the market is a voting machine, but over the long term it's a weighing machine. One imperfect but simple way to consider how the market perception of a company has shifted is to compare the change in the earnings per share (EPS) with the share price movement.
During three years of share price growth, Distribuidora Internacional de Alimentación moved from a loss to profitability. That would generally be considered a positive, so we'd expect the share price to be up.
The graphic below depicts how EPS has changed over time (unveil the exact values by clicking on the image).
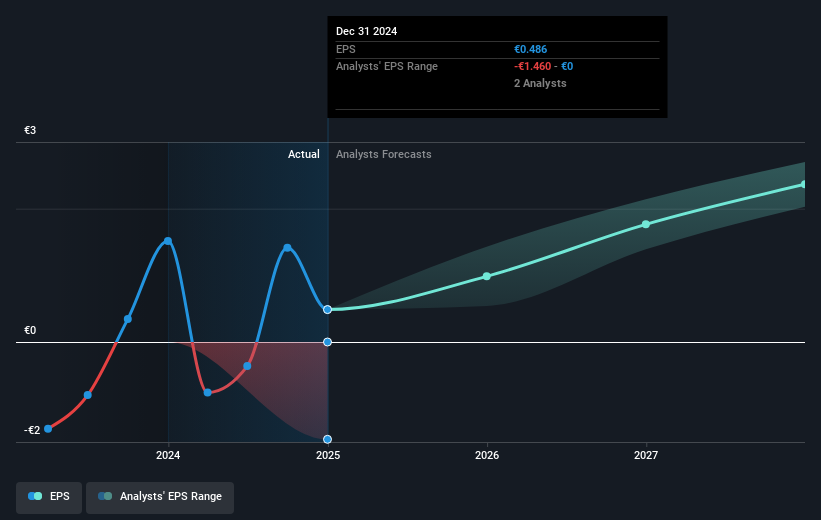
We know that Distribuidora Internacional de Alimentación has improved its bottom line over the last three years, but what does the future have in store? This free interactive report on Distribuidora Internacional de Alimentación's balance sheet strength is a great place to start, if you want to investigate the stock further.
A Different Perspective
It's nice to see that Distribuidora Internacional de Alimentación shareholders have received a total shareholder return of 91% over the last year. Notably the five-year annualised TSR loss of 9% per year compares very unfavourably with the recent share price performance. We generally put more weight on the long term performance over the short term, but the recent improvement could hint at a (positive) inflection point within the business. It's always interesting to track share price performance over the longer term. But to understand Distribuidora Internacional de Alimentación better, we need to consider many other factors. Consider for instance, the ever-present spectre of investment risk. We've identified 5 warning signs with Distribuidora Internacional de Alimentación (at least 2 which can't be ignored) , and understanding them should be part of your investment process.
But note: Distribuidora Internacional de Alimentación may not be the best stock to buy. So take a peek at this free list of interesting companies with past earnings growth (and further growth forecast).
Please note, the market returns quoted in this article reflect the market weighted average returns of stocks that currently trade on Spanish exchanges.
If you're looking to trade Distribuidora Internacional de Alimentación, open an account with the lowest-cost platform trusted by professionals, Interactive Brokers.
With clients in over 200 countries and territories, and access to 160 markets, IBKR lets you trade stocks, options, futures, forex, bonds and funds from a single integrated account.
Enjoy no hidden fees, no account minimums, and FX conversion rates as low as 0.03%, far better than what most brokers offer.
Sponsored ContentNew: Manage All Your Stock Portfolios in One Place
We've created the ultimate portfolio companion for stock investors, and it's free.
• Connect an unlimited number of Portfolios and see your total in one currency
• Be alerted to new Warning Signs or Risks via email or mobile
• Track the Fair Value of your stocks
Have feedback on this article? Concerned about the content? Get in touch with us directly. Alternatively, email editorial-team (at) simplywallst.com.
This article by Simply Wall St is general in nature. We provide commentary based on historical data and analyst forecasts only using an unbiased methodology and our articles are not intended to be financial advice. It does not constitute a recommendation to buy or sell any stock, and does not take account of your objectives, or your financial situation. We aim to bring you long-term focused analysis driven by fundamental data. Note that our analysis may not factor in the latest price-sensitive company announcements or qualitative material. Simply Wall St has no position in any stocks mentioned.
About BME:DIA
Distribuidora Internacional de Alimentación
Distribuidora Internacional de Alimentación, S.A.
Moderate with reasonable growth potential.
Similar Companies
Market Insights

Community Narratives


